Regulatory Capital Adequacy for Life Insurance Companies

Link: https://www.soa.org/4a194f/globalassets/assets/files/resources/research-report/2023/erm-191-reg-capital-with-final-visuals.pdf

Graphic:

Excerpt:

The purpose of this paper is to introduce the concept of capital and key related terms, as well as to compare and contrast four key regulatory capital regimes. Not only is each regime’s methodology explained with key terms defined and formulas provided, but illustrative applications of each approach are provided via an example with a baseline scenario. Comparison among these capital regimes is also provided using this same model with two alternative scenarios.

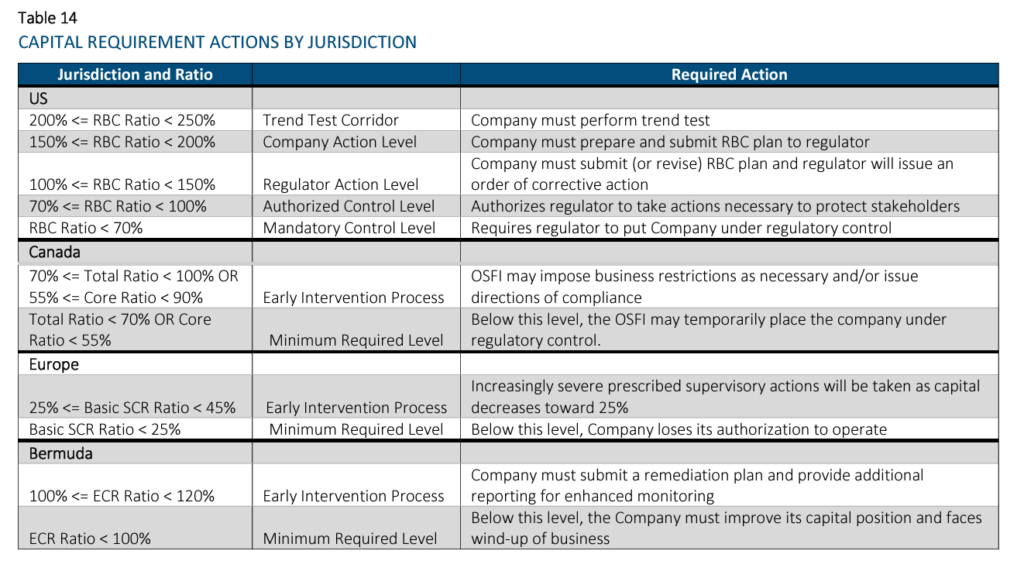
The four regulatory required capital approaches discussed in this paper are National Association of Insurance Commissioners’ (NAIC) Risk-Based Capital (RBC; the United States), Life Insurer Capital Adequacy Test (LICAT; Canada), Solvency II (European Union), and the Bermuda Insurance Solvency (BIS) Framework which describes the Bermuda Solvency Capital Requirement (BSCR). These terms may be used interchangeably. These standards apply to a large portion of the global life insurance market and were chosen to give the reader a better understanding of how required capital varies by jurisdiction, and the impact of the measurement method on life insurance company capital.

All of these approaches are similar in that they identify key risks for which capital should be held (e.g., asset default and market risks, insurance risks, etc.). However, they differ in significant ways too, including their defined risk taxonomy and risk diversification / aggregation methodologies, as well as required minimum capital thresholds and corresponding implications. Another key difference is that the US’s RBC methodology is largely factor-based, while the other methodologies are model-based approaches. For the model-based approaches, Solvency II and BIS allow for the use of internal models when certain conditions are satisfied. Another difference is that the RBC methodology is largely derived using book values, while the others use economic-based measurements.

As mentioned above, this paper provides a model that calculates the capital requirements for each jurisdiction. The model is used to compare regulatory solvency capital using identical portfolios for both assets and liabilities. For simplicity, we have assumed that all liabilities originated in the same jurisdiction as the calculation. As the objective of the model is to illustrate required capital calculation methodology differences, a number of modeling simplifications were employed and detailed later in the paper. The model considers two products – term insurance and payout annuities, approximately equally weighted in terms of reserves. The assets consist of two non-callable bonds of differing durations, mortgages, real estate, and equities. Two alternative scenarios have been considered, one where the company invests in riskier assets than assumed in the base case and one where the liability mix is more heavily weighted to annuities as compared to the base case.

Author(s): Ben Leiser, FSA, MAAA; Janine Bender, ASA, MAAA; Brian Kaul

Publication Date: July 2023

Publication Site: Society of Actuaries

Group Life COVID-19 Mortality Survey Report

Link: https://www.soa.org/4a368a/globalassets/assets/files/resources/research-report/2022/group-life-covid-19-mortality-03-2022-report.pdf

Graphic:

Excerpt:

Tables 2.1 through 2.41 display high-level incidence results for the second quarter of 2020 through the first quarter of 2022 compared to the 2017-2019 baseline period for each combination of (a) incurred/reported basis and (b) count/amount basis as of March 31, 2022. In these tables, the number of COVID-19 claims has not been adjusted for seasonality, but the ratios to baseline have been adjusted for seasonality.


Note that additional data reported in April and May 2022 indicated that the 1Q 2022 excess mortality would likely complete downward from the 19.9% shown below using March data. The fully complete 1Q 2022 excess mortality is expected to remain above 15%.

….

The 24-month period of April 2020 through March 2022 showed the following Group Life mortality results:
• Estimated reported Group Life claim incidence rates were up 20.0% on a seasonally-adjusted basis
compared to 2017–2019 reported claims.
• Estimated incurred Group Life incidence rates were 20.9% higher than baseline on a seasonally-adjusted
basis. As noted above, the incurred incidence rates in February and March 2022 are based on fairly
incomplete data, so they are subject to change and should not be fully relied upon at this point.

Author(s):

Thomas J. Britt, FSA, MAAA
Paul Correia, FSA, MAAA
Patrick Hurley, FSA, MAAA
Mike Krohn, FSA, CERA, MAAA
Tony LaSala, FSA, MAAA
Rick Leavitt, ASA, MAAA
Robert Lumia, FSA, MAAA
Cynthia S. MacDonald, FSA, MAAA, SOA
Patrick Nolan, FSA, MAAA, SOA
Steve Rulis, FSA, MAAA
Bram Spector, FSA, MAAA

Publication Date: August 2022

Publication Site: SOA

Old Age Mortality Experience Study Report

Link: https://www.soa.org/resources/experience-studies/2022/old-age-mortality/

Graphic:

Excerpt:

The Society of Actuaries (SOA) Research Institute released a report that examines older age mortality (OAM) with a focus on attained ages 70 and above. The report helps determine whether refinements were needed in the 2015 Valuation Basic Tables. Analysis was performed by sex, issue age and attained age, issue year cohorts, smoking risk classification, benefit band, select vs ultimate period, and interactions.

Author(s):

Old Age Mortality Subgroup of the Individual Life Experience Committee

Publication Date: October 2022

Publication Site: Society of Actuaries

2020-2021 Excess Deaths in the U.S. General Population by Age and Sex

Link: https://www.soa.org/resources/research-reports/2022/excess-death-us/

Full report: https://www.soa.org/4a55a7/globalassets/assets/files/resources/research-report/2022/excess-death-us.pdf

Graphic:

Excerpt:

The data used for this analysis was provided by the CDC as of August 17, 2022 and includes incurred deaths
by week, beginning on December 29, 2019 and going through July 2, 2022. For 2020, the CDC defines Week
1 as ranging from December 29, 2019 through January 4, 2020 and Week 52 as ranging from December 19,
2020 through December 26, 2020, so when reporting on 2020 results, this convention is used. The year
2021 begins on December 27, 2020 and runs through January 2, 2022. For the purposes of this analysis, the
start of the COVID-19 active period is March 22, 2020.
Due to the delay in reporting, the actual deaths have been completed based on factors that vary by age
and sex. These are shown below along with the expectations that are based on the five-year trend after
adjusting for seasonality.

These data are as of August 17, 2022 and exclude deaths that occurred after July 2, 2022. Figure 1 shows
that, for most months, the total A/E ratio is much greater than 100%, while the A/E ratio excluding COVID19 deaths is also greater than 100% by a few percent.

Author(s): Rick Leavitt, ASA, MAAA

Publication Date: August 2022

Publication Site: Society of Actuaries Research Institute

COVID-19 Mortality Study: Analytics – 2021 Q2

Link: https://www.limra.com/en/research/benchmarks/u.s.-individual-life-insurance-covid-19-mortality-experience-study/analytics/2021-q2/

Graphic:

Excerpt:

LIMRA, Reinsurance Group of America (RGA), the Society of Actuaries (SOA) Research Institute, and TAI have collaborated on an ongoing effort to analyze the impact of COVID-19 on the
individual life insurance industry’s mortality experience and share the emerging results with the insurance industry and the public. The Individual Life COVID-19 Project Work Group (Work
Group) was formed as a collaboration of LIMRA, RGA, the SOA Research Institute, and TAI to design, implement, and create the study and to produce and distribute a variety of analyses.
This report is the fifth public release from this collaboration and contains the results of the study of excess mortality for individual life insurance to include the second quarter of 2021.
Data from 31 companies representing approximately 72% of the industry face amount in force have been included in the analysis in this report. A total of 3.0 million death claims from
individual life policies from 2015 through June 30, 2021 make up the basis of the analysis.


Highlights for the 2nd Quarter

  • The second quarter of 2021 showed a significant realignment of the actual to expected relative mortality ratios, across many different cuts of the data.
  • It is worth noting that the third quarter 2021 results will likely not be as favorable due to the impact of the COVID-19 Delta variant whose impact first started in July 2021 and peaked
    around mid- September
  • All age groups improved in the second quarter compared to the first quarter of 2021, but the improvement was more dramatic in the older ages. While the three age groups shown under
    age 65 were still significantly over the trend established by 2015-2019, the age 65-84 group was within the 95% confidence bands and the age 85+ group was significantly better than the
    2015-2019 trend (p < 0.05).
  • Whereas the pandemic experience so far had showed substantial variations across different regions, this appears to have moderated during the 2nd quarter of 2022.

Author(s): Individual Life COVID-19 Project Work Group, SOA

Publication Date: May 2022, accessed 21 May 2022

Publication Site: LIMRA

Rise in Non-Covid-19 Deaths Hits Life Insurers

Link: https://www.wsj.com/articles/rise-in-non-covid-19-deaths-hits-life-insurers-11645576252

Graphic:

Excerpt:

In earnings calls for the past two quarters, Globe Life Inc.,Hartford Financial Services Group Inc., Primerica Inc. andReinsurance Group of America Inc. were among insurers noting higher non-Covid-19 deaths, compared with pre-pandemic baselines.

“The losses we are seeing continue to be elevated over 2019 levels due at least in part, we believe, to the pandemic and the existence of either delayed or unavailable healthcare,” Globe Life finance chief Frank Svoboda told analysts and investors earlier this month.

Among the non-coronavirus-specific claims are deaths from heart and circulatory issues and neurological disorders, he said. “We anticipate that they’ll start to be less impactful over the course of 2022 but we do anticipate that we’ll still at least see some elevated levels throughout the year,” he said.

Primerica executives similarly cautioned in their fourth-quarter call about outsize numbers of non-Covid-19 deaths in 2022. “Some of these will be the result of delayed medical care or the increased incidence of societal-related issues, such as the increased prevalence of substance abuse,” Chief Financial Officer Alison Rand said in an email interview.

From early stages of the pandemic, many medical professionals have raised concerns about Americans’ untreated health problems, as Covid-19 put stress on the nation’s healthcare system.

Author(s): Leslie Scism

Publication Date: 23 Feb 2022

Publication Site: WSJ