The Ten Most Misleading Charts During Donald Trump’s Presidency

Link: https://policyviz.com/2021/02/15/the-ten-most-misleading-charts-during-donald-trumps-presidency/

Graphic:

Excerpt:

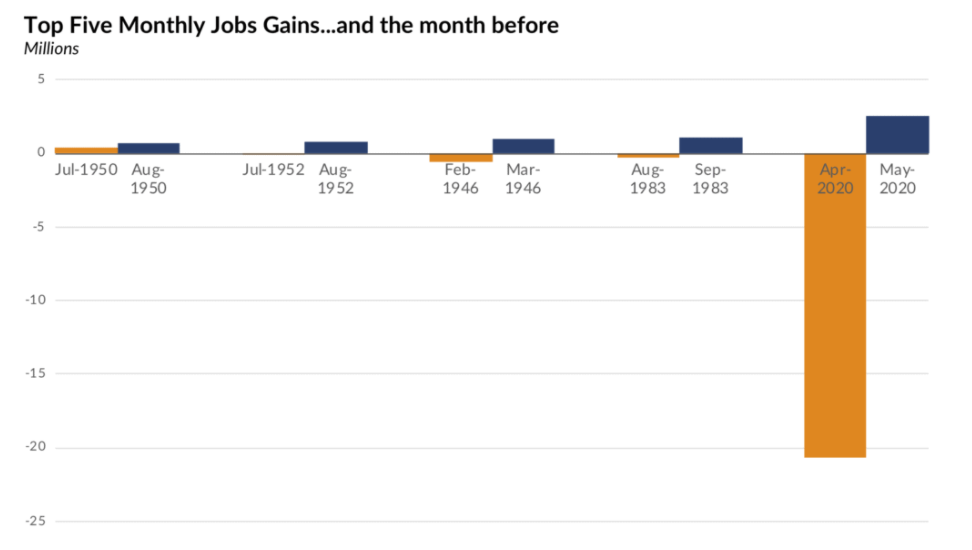
Over the course of four years as President, Donald Trump made more than 30,000 false or misleading claims, according to the Washington Post Fact Checker. It should be no surprise, then, that some of these took the form of data visualizations. Here are the top ten most misleading charts, graphs, maps, and tables from the Trump Administration over the past four years.

Author(s): Jonathan Schwabish

Publication Date: 15 February 2021

Publication Site: PolicyViz

American Indicators: The Faces And Stories Behind The Economic Statistics

Link: https://www.npr.org/2021/02/20/969122775/american-indicators-the-faces-and-stories-behind-the-economic-statistics

Graphic:

Excerpt:

When the coronavirus pandemic hit last year, big parts of the U.S. economy just turned off. Voluntary social distancing and lockdowns, like those during the first wave in March, were necessary to help “flatten the curve” of COVID-19’s spread throughout the country, but these lockdowns had ripple effects on the economy.

Millions suddenly lost their jobs, pushing unemployment to historic highs. When travel ground to a halt, hotel occupancy plummeted — and so did profits, which dropped 84.6% in 2020 from a year earlier. In New Jersey, that meant hotel owner Bhavesh Patel had to furlough employees to make ends meet.

….

That factory is one of the parts of the economy that are slowly coming back. Some sectors are thriving, while others continue to struggle, putting different people in vastly different situations. NPR will spend the year following four people who will help illustrate the arc of the expected economic recovery.

Author(s): Mallory Yu, Ari Shapiro

Publication Date: 20 February 2021

Publication Site: NPR

Retirement Insecurity 2021 | Americans’ Views of Retirement

Press Release: https://www.nirsonline.org/2021/02/amid-political-division-americans-united-in-retirement-worry/

Webinar recording:

Webinar slides: https://www.nirsonline.org/wp-content/uploads/2021/02/FINAL-Public-Opinion-Webinar-Slides-Feb-25-2021.pdf

Graphic:

Excerpt:

This new national survey of working-age Americans also reveals that the COVID-19 pandemic has exacerbated worries about achieving financial security in retirement.

More than half of Americans (51 percent) say that the COVID-19 pandemic has increased concerns about achieving financial security in retirement. And the COVID-19 concern is high across party lines: 57 percent among Democrats; 50 percent for Independents; and at 44 percent for Republicans.

Author(s): Dan Doonan, Kelly Kenneally, Tyler Bond

Publication Date: 17 February 2021

Publication Site: National Institute on Retirement Security

Former SolarWinds CEO blames intern for ‘solarwinds123’ password leak

Link: https://www.cnn.com/2021/02/26/politics/solarwinds123-password-intern/index.html

Excerpt:

Current and former top executives at SolarWinds are blaming a company intern for a critical lapse in password security that apparently went undiagnosed for years.

The password in question, “solarwinds123,” was discovered in 2019 on the public internet by an independent security researcher who warned the company that the leak had exposed a SolarWinds file server.

Several US lawmakers ripped into SolarWinds for the password issue Friday, in a joint hearing by the House Oversight and Homeland Security committees.

“I’ve got a stronger password than ‘solarwinds123’ to stop my kids from watching too much YouTube on their iPad,” said Rep. Katie Porter. “You and your company were supposed to be preventing the Russians from reading Defense Department emails!”

Author(s): Brian Fung and Geneva Sands

Publication Date: 26 February 2021

Publication Site: CNN

Analyzing Census Data in Excel

Link: https://www.census.gov/data/academy/courses/excel.html

Description

Excel is a very popular tool among all data users. It can be leveraged to unlock the value of open data of all kinds, and it is particularly well-suited to transforming, analyzing, and visualizing Census data. This course will show how to use Excel to access, manipulate, and visualize Census data.  It will also tools for doing advanced statistical analysis.

After completing this course, you will be able to:
    ✓    Access data from the Census Bureau using the American FactFinder
    ✓    Format tables for data analysis
    ✓    Perform basic and advanced analysis of Census data using Excel
    ✓    Create data visualizations such as sparklines, hierarchical charts, and histograms

Author(s): Andy Hecktman, Alexandra Barker

Date Accessed: 27 February 2021

Publication Site: U.S. Census Bureau

The R Inferno

Link: https://www.burns-stat.com/pages/Tutor/R_inferno.pdf

Graphic:

Abstract: If you are using R and you think you’re in hell, this is a map for
you.

Excerpt:

I wandered through
http://www.r-project.org.

To state the good I found there, I’ll also say what else I saw.

Having abandoned the true way, I fell into a deep sleep and awoke in a deep dark wood. I set out to escape the wood, but my path was blocked by a lion. As I fled to lower ground, a figure appeared before me. “Have mercy on me, whatever you are,” I cried, “whether shade or living human.”

Author(s): Patrick Burns

Publication Date: 30 April 2011

Publication Site: Burns Statistics

What does the unemployment rate measure?

Graphic:

Excerpt:

The BLS releases six measures of labor market slack in the monthly jobs report. These include the official unemployment rate (U-3), discussed above, as well as more narrow definitions, called U-1 and U-2, which respectively include only those unemployed at least 15 weeks (the long-term unemployed) or for less than a month (the short-term unemployed). The BLS also publishes broader definitions of slack. The U-6 rate, for instance, counts all those who are technically unemployed plus those are who are working part-time but would prefer full time work, and those “marginally attached to the labor force,” that is, people who say they want either a full-time or part-time job, have not looked for work in the most recent four weeks, but have looked for a job sometime in the past 12 months. When adults classified as “marginally attached” report that they did not recently seek work because they do not believe jobs are available for them, they are classified as “discouraged workers.” The U-4 counts the unemployed and discouraged workers, while U-5 adds in other marginally attached workers. In January, the broadest of these measures, U-6, stood at 11.1 percent, 4.8 percentage points higher than the official unemployment rate.

Author(s): Stephanie Aaronson

Publication Date: 18 February 2021

Publication Site: Brookings