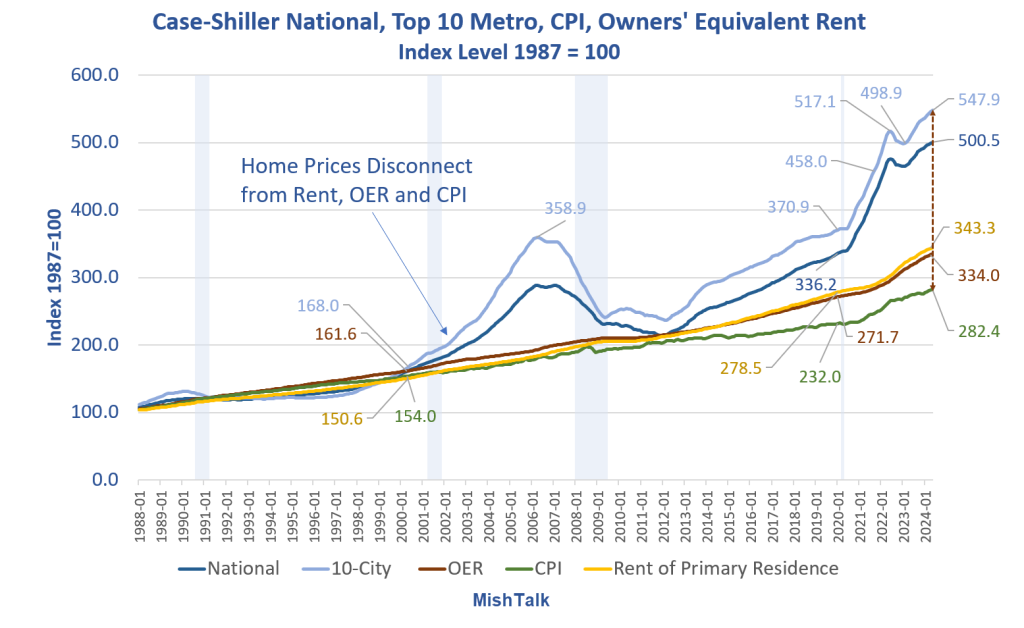
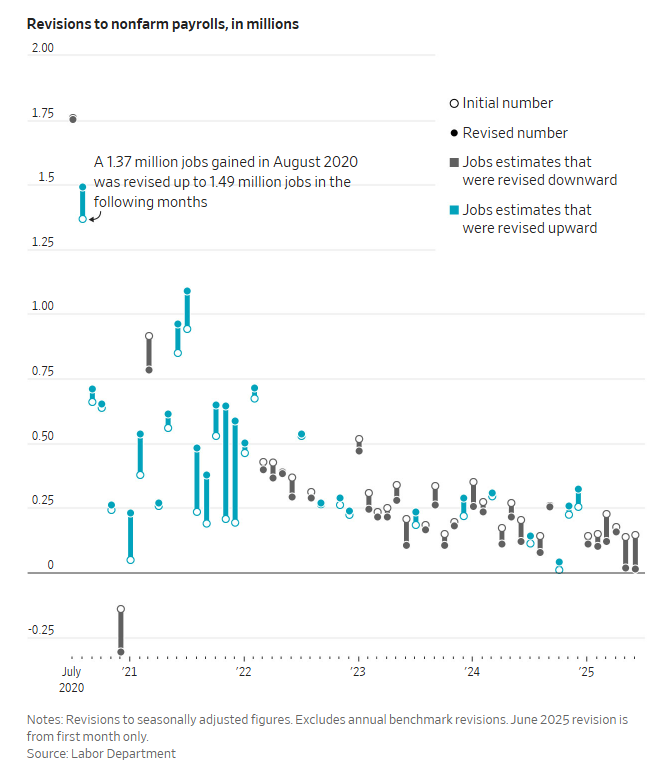
Phantoms never die: living with unreliable population data

Link: https://www.macs.hw.ac.uk/~andrewc/papers/JRSS2016B.pdf

Graphic:

Summary:

The analysis of national mortality trends is critically dependent on the quality of the population, exposures and deaths data that underpin death rates. We develop a framework that allows us to assess data reliability and to identify anomalies, illustrated, by way of example, using England and Wales population data. First, we propose a set of graphical diagnostics that help to pinpoint anomalies. Second, we develop a simple Bayesian model that allows us to quantify objectively the size of any anomalies. Two-dimensional graphical diagnostics and modelling techniques are shown to improve significantly our ability to identify and quantify anomalies. An important conclusion is that significant anomalies in population data can often be linked to uneven patterns of births of people in cohorts born in the distant past. In the case of England and Wales, errors of more than 9% in the estimated size of some birth cohorts can be attributed to an uneven pattern of births. We propose methods that can use births data to improve estimates of the underlying population exposures. Finally, we consider the effect of anomalies on mortality forecasts and annuity values, and we find significant effects for some cohorts. Our methodology has general applicability to other sources of population data, such as the Human Mortality Database.

Keywords: Baby boom;Cohort–births–deaths exposures methodology; Convexity adjustment ratio; Deaths; Graphical diagnostics; Population data

Author(s): Andrew J.G.Cairns, Heriot-Watt University, Edinburgh, UK David Blake, Cass Business School, London, UK Kevin Dowd Durham University Business School, UK and Amy R. Kessler Prudential Retirement, Newark, USA

Publication Date: 2016

Publication Site: Journal of the Royal Statistical Society

J. R. Statist. Soc. A (2016) 179, Part 4, pp. 975–1005

Unhelpful, inflammatory Jama Network Open paper suggests that people in Red states dream up vaccine injuries

Link:https://www.drvinayprasad.com/p/unhelpful-inflammatory-jama-network?utm_source=post-email-title&publication_id=231792&post_id=143191018&utm_campaign=email-post-title&isFreemail=true&r=9bg2k&triedRedirect=true&utm_medium=email

Graphic:

Excerpt:

Now let’s turn to the paper. Here is what the authors find (weak correlation btw voting and vaccine injuries) , and here are the issues.

  1. These data are ecological. It doesn’t prove that republicans themselves are more likely to report vaccine injuries. It would not be difficult to pair voting records with vaccine records at an individual patient level if the authors wished to do it right— another example of research laziness.
  2. What if republicans actually DO have more vaccine injuries? The authors try to correct for the fact by adjusting for influenza adverse events.

Let me explain why this is a poor choice. The factors that predict whether someone has an adverse event to influenza vaccine may not be the same as those that predict adverse events from covid shots. It could be that there are actually more covid vaccine injuries in one group than another— even though both had equal rates of influenza injuries.

Another way to think of it is, there can be two groups of people and you can balance them by the rate with which they get headaches from drinking wine, but one group can be more likely to get headaches from reading without glasses because more people in that group wear glasses. In other words, states with more republicans might be states with specific co-morbidities that predict COVID vaccine adverse side effects but not influenza vaccine side effects. We already know that COVID vaccine injuries do affect different groups (young men, for e.g.).

Author(s): Vinay Prasad

Publication Date: 2 Apr 2024

Publication Site: Vinay Prasad’s Thoughts and Observations at substack

Links Between Early Retirement and Mortality

Link: https://www.ssa.gov/policy/docs/workingpapers/wp93.html#:~:text=Relative%20to%20those%20retiring%20at,odds%20of%20dying%20by%200.1089

Graphic:

Excerpt:

In this paper I use the 1973 cross-sectional Current Population Survey (CPS) matched to longitudinal Social Security administrative data (through 1998) to examine the relationship between retirement age and mortality for men who have lived to at least age 65 by year 1997 or earlier.1 Logistic regression results indicate that controlling for current age, year of birth, education, marital status in 1973, and race, men who retire early die sooner than men who retire at age 65 or older. A positive correlation between age of retirement and life expectancy may suggest that retirement age is correlated with health in the 1973 CPS; however, the 1973 CPS data do not provide the ability to test that hypothesis directly.

Regression results also indicate that the composition of the early retirement variable matters. I represent early retirees by four dummy variables representing age of entitlement to Social Security benefits—exactly age 62 to less than 62 years and 3 months (referred to as exactly age 62 in this paper), age 62 and 3 months to 62 and 11 months, age 63, and age 64. The reference variable is men taking benefits at age 65 or older. I find that men taking benefits at exactly age 62 have higher mortality risk than men taking benefits in any of the other four age groups. I also find that men taking benefits at age 62 and 3 months to 62 and 11 months, age 63, and age 64 have higher mortality risk than men taking benefits at age 65 or older. Estimates of mortality risk for “early” retirees are lowered when higher-risk age 62 retirees are combined with age 63 and age 64 retirees and when age 62 retirees are compared with a reference variable of age 63 and older retirees. Econometric models may benefit by classifying early retirees by single year of retirement age—or at least separating age 62 retirees from age 63 and age 64 retirees and age 63 and age 64 retirees from age 65 and older retirees—if single-year breakdowns are not possible.

The differential mortality literature clearly indicates that mortality risk is higher for low-educated males relative to high-educated males. If low-educated males tend to retire early in relatively greater numbers than high-educated males, higher mortality risk for such individuals due to low educational attainment would be added to the higher mortality risk I find for early retirees relative to that for normal retirees. Descriptive statistics for the 1973 CPS show that a greater proportion of age 65 retirees are college educated than age 62 retirees. In addition, a greater proportion of age 64 retirees are college educated than age 62 retirees, and a lesser proportion of age 64 retirees are college educated than age 65 or older retirees. Age 63 retirees are only slightly more educated than age 62 retirees.

Despite a trend toward early retirement over the birth cohorts in the 1973 CPS, I do not find a change in retirement age differentials over time. However, I do find a change in mortality risk by education over time. Such a change may result from the changing proportion of individuals in each education category over time, a trend toward increasing mortality differentials by socioeconomic status, or a combination of the two.

This paper does not directly explore why a positive correlation between retirement age and survival probability exists. One possibility is that men who retire early are relatively less healthy than men who retire later and that these poorer health characteristics lead to earlier deaths. One can interpret this hypothesis with a “quasidisability” explanation and a benefit optimization explanation. Links between these interpretations and my analysis of the 1973 CPS are fairly speculative because I do not have the appropriate variables needed to test these interpretations.

A quasi-disability explanation, following Kingson (1982), Packard (1985), and Leonesio, Vaughan, and Wixon (2000), could be that a subgroup of workers who choose to take retired-worker benefits at age 62 is significantly less healthy than other workers but unable to qualify for disabled-worker benefits. An econometric model with a mix of both these borderline individuals and healthy individuals retiring at age 62 and with almost no borderline individuals retiring at age 65 could lead to a positive correlation between retirement and mortality, even if a greater percentage of individuals who retire at age 62 are healthy than unhealthy. Evidence for this hypothesis can be inferred from the finding that retiring at exactly age 62 increases the odds of dying in a unit age interval by 12 percent relative to men retiring at 62 and 3 months to 62 and 11 months for men in the 1973 CPS. In addition, retiring exactly at age 62 increases the odds of dying by 23 percent relative to men retiring at age 63 and by 24 percent relative to men retiring at age 64. A group with relatively severe health problems waiting for their 62nd birthday to take benefits could create this result.

An explanation based on benefit optimization follows Hurd and McGarry’s research (1995, 1997) in which they find that individuals’ subjective survival probabilities roughly predict actual survival. If men in the 1973 CPS choose age of benefit receipt based on expectations of their own life expectancy, then perhaps a positive correlation between age of retirement and life expectancy implies that their expectations are correct on average. If actuarial reductions for retirement before the normal retirement age are linked to average life expectancy and an individual’s life expectancy is below average, it may be rational for that individual to retire before the normal retirement age. Evidence for this hypothesis can be inferred from the fact that men retiring at age 62 and 3 months to age 62 and 11 months, age 63, and age 64 all experience greater mortality risk than men retiring at age 65 or older. If only men with severe health problems who are unable to qualify for disability benefits are driving the results, we probably would not expect to see this result. We might expect most of these individuals to retire at the earliest opportunity (exactly age 62).2

Author(s): Hilary Waldron

Publication Date: August 2001

Publication Site: Social Security Office of Policy, ORES Working Paper No 93

Supercentenarian and remarkable age records exhibit patterns indicative of clerical errors and pension fraud

Link: https://www.biorxiv.org/content/10.1101/704080v3

PDF: https://www.biorxiv.org/content/10.1101/704080v3.full.pdf

Graphic:

Abstract

The observation of individuals attaining remarkable ages, and their concentration into geographic sub-regions or ‘blue zones’, has generated considerable scientific interest. Proposed drivers of remarkable longevity include high vegetable intake, strong social connections, and genetic markers. Here, we reveal new predictors of remarkable longevity and ‘supercentenarian’ status. In the United States, supercentenarian status is predicted by the absence of vital registration. The state-specific introduction of birth certificates is associated with a 69-82% fall in the number of supercentenarian records. In Italy, England, and France, which have more uniform vital registration, remarkable longevity is instead predicted by poverty, low per capita incomes, shorter life expectancy, higher crime rates, worse health, higher deprivation, fewer 90+ year olds, and residence in remote, overseas, and colonial territories. In England and France, higher old-age poverty rates alone predict more than half of the regional variation in attaining a remarkable age. Only 18% of ‘exhaustively’ validated supercentenarians have a birth certificate, falling to zero percent in the USA, and supercentenarian birthdates are concentrated on days divisible by five: a pattern indicative of widespread fraud and error. Finally, the designated ‘blue zones’ of Sardinia, Okinawa, and Ikaria corresponded to regions with low incomes, low literacy, high crime rate and short life expectancy relative to their national average. As such, relative poverty and short lifespan constitute unexpected predictors of centenarian and supercentenarian status and support a primary role of fraud and error in generating remarkable human age records.

Author(s): Saul Justin Newman

https://doi.org/10.1101/704080

Publication Date: 14 Mar 2024

Publication Site: bioRXiV

#20: Many great things you missed this year

Link: https://www.scientificdiscovery.dev/p/20-so-many-great-things-you-missed

Graphic:

Excerpt:

You can see that, in childhood, in the US, the most common causes of death are ‘external causes’. This is a broad category that includes accidents, falls, violence, and overdoses, and is shown in red. But there’s also a notable contribution from birth disorders (in muted green), childhood cancers (in blue), and respiratory diseases (in cyan).

The share of deaths in childhood from cancers stood out to me. We’ve seen lots of progress against many childhood cancers over the last 50 years — notably in treating leukemia, brain cancers, kidney cancers, lymphomas, and retinoblastoma — but this is a reminder that there’s still further to go.

From adolescence until middle-age, ‘external causes’ are now the overwhelming cause of death. Around 80% of deaths at the age of 20 in the US are due to external causes. These result from causes such as accidents, violence, and overdoses.

At older ages, diseases rise in importance. Causes of death also become more varied, although cardiovascular diseases and cancers are the most common.

You might also be wondering about the brown category at the bottom, called ‘special ICD codes’. That’s a placeholder category in the system for deaths caused by new diseases — predominantly Covid-19, since the data spans 2018 to 2021.3

Author(s): SALONI DATTANI

Publication Date: 16 Mar 2022

Publication Site: Scientific Discovery on substack

Can Baby Bonds Fight the Wealth Gap and Racial Inequality? Connecticut Aims to Find Out.

Link: https://www.ineteconomics.org/perspectives/blog/can-baby-bonds-fight-the-wealth-gap-and-propel-racial-equality-connecticut-aims-to-find-out

Excerpt:

Connecticut has made history as the first state to implement a baby bonds program — fully funded for 12 years of babies.

The state will invest $3,200 for each baby covered by HUSKY, the state’s Medicaid program – that’s about 15,000 babies a year and a whopping 36% of the state’s children. Kids are automatically enrolled; no action is required. Upon reaching adulthood (18-30), participants can claim funds for specific wealth-and-opportunity-building purposes like higher education, a home purchase, or starting a business in the state. To receive the funds, they have to be Connecticut residents and need to complete a financial literacy course (hopefully not one funded by self-serving Wall Street firms). The initial $3,200 investment is anticipated to grow to $11,000 – $24,000, depending on when claims are filed.

Turning the idea of baby bonds into reality was a rocky road: the Democratic-led Connecticut General Assembly passed the bill in 2021, championed by former Democratic Treasurer Shawn Wooden. However, Governor Lamont and his team initially opposed the program’s funding, citing concerns over borrowing more than $50 million annually. Internal conflict heated up, as revealed in a January 2023 investigation by the Connecticut Mirror, exposing tensions between Wooden and the governor’s staff. Yet, following the publication, the situation took an unexpected turn. The program became a reality.

The sticking point of funding was solved by a plan to use a $393 million reserve fund established in 2019 during the restructuring of the state’s cash-strapped pension fund for municipal teachers. Originally designed to cover shortfalls in pension fund contributions, this reserve could be repurposed. To safeguard the pension system and meet ratings agencies’ requirements, a $12 million insurance policy was necessary, leaving approximately $381 million available for investment in the baby bonds program.

Author(s): Lynn Parramore

Publication Date: 27 Feb 2024

Publication Site: Institute for New Economic Thinking

The mystery of the ‘golden cohort’

Link:https://www.bbc.com/news/uk-15024436

Graphic:

Excerpt:

The life experience of British people born between the years 1925 and 1934 has long had demographers and insurance companies scratching their heads.

For reasons which remain unclear, individuals within this slice of the UK population have been living longer and healthier lives than groups both older and younger.

Today the Office for National Statistics returns to the mystery of the so-called “golden cohort”, trying to understand better why the members of the generation born in the midst of the Great Depression have been enjoying higher rates of mortality improvement throughout their adult lives.

One tool used to track the golden cohort is a heat chart which, in this case, looks at annual mortality improvements for men and women. It takes a bit of explaining, but the diagrams reflect the social history of Britain over the last century or so.

Starting with men (Figure 1a), the most obvious feature of the heat chart are the vertical bands of blue and brown in the bottom left corner. Blue represents worsening mortality and brown improving, so the blue slice closest furthest to the left is the cohort decimated by World War I and the influenza pandemic.

Author(s):

Publication Date: 23 Sep 2011

Publication Site: BBC

Do No Harm Guide: Crafting Equitable Data Narratives

Link: https://www.urban.org/research/publication/do-no-harm-guide-crafting-equitable-data-narratives

Graphic:

Excerpt:

KEY FINDINGS

The authors of the 12 essays in this guide work through how to include equity at every step of the data collection and analysis process. They recommend that data practitioners consider the following:

  1. Community engagement is necessary. Often, data practitioners take their population of interest as subjects and data points, not individuals and people. But not every person has the same history with research, nor do all people need the same protections. Data practitioners should understand who they are working with and what they need.
  2. Who is not included in the data can be just as important as who is. Most equitable data work emphasizes understanding and caring for the people in the study. But for data narratives to truly have an equitable framing, it is just as important to question who is left out and how that exclusion may benefit some groups while disadvantaging others.
  3. Conventional methods may not be the best methods. Just as it is important for data practitioners to understand who they are working with, it is also important for them to question how they are approaching the work. While social sciences tend to emphasize rigorous, randomized studies, these methods may not be the best methods for every situation. Working with community members can help practitioners create more equitable and effective research designs.

By taking time to deeply consider how we frame our data work—the definitions, questions, methods, icons, and word choices—we can create better results. As the field undertakes these new frontiers, data practitioners, researchers, policymakers, and advocates should keep front of mind who they include, how they work, and what they choose to show.

Author(s):

(editors) Jonathan Schwabish,
Alice Feng,
Wesley Jenkins

Publication Date: 16 Feb 2024

Publication Site: Urban Institute

Half of College Grads Are Working Jobs That Don’t Use Their Degrees

Link: https://www.wsj.com/lifestyle/careers/college-degree-jobs-unused-440b2abd

Graphic:

Excerpt:

Of the graduates in non-college-level jobs a year after leaving college, the vast majority remained underemployed a decade later, according to researchers at labor analytics firm Burning Glass Institute and nonprofit Strada Education Foundation, which analyzed the résumés of workers who graduated between 2012 and 2021. 

More than any other factor analyzed—including race, gender and choice of university—what a person studies determines their odds of getting on a college-level career track. Internships are also critical.

….

Bachelor’s degree holders in college-level jobs earn nearly 90% more than people with just a high-school diploma in their 20s, according to a Burning Glass analysis of 2022 U.S. Census Bureau data. 

By comparison, underemployed college graduates earn 25% more than high-school graduates.

….

Contrary to conventional wisdom, not all degrees in science, technology, engineering and math, or STEM, disciplines are a sure bet to landing a job that reflects a college education, the study found. 

Nearly half of people who majored in biology and biomedical sciences—47%—remained underemployed five years after graduating. Likewise, business majors less focused on quantitative skills, such as marketing and human resources, were twice as likely to be underemployed than those with math-intensive business degrees, such as accounting or finance. The data cover graduates who didn’t get master’s or other advanced degrees after college.

Author(s): Vanessa Fuhrmans and Lindsay Ellis

Publication Date: 22 Feb 2024

Publication Site: WSJ

‘Fourth Wave’ of Opioid Epidemic Crashes Ashore, Propelled by Fentanyl and Meth

Link:https://kffhealthnews.org/news/article/fourth-wave-opioid-epidemic-fentanyl-millennium-health-report/

Excerpt:

The United States is knee-deep in what some experts call the opioid epidemic’s “fourth wave,” which is not only placing drug users at greater risk but is also complicating efforts to address the nation’s drug problem.

These waves, according to a report out today from Millennium Health, began with the crisis in prescription opioid use, followed by a significant jump in heroin use, then an increase in the use of synthetic opioids like fentanyl.

The latest wave involves using multiple substances at the same time, combining fentanyl mainly with either methamphetamine or cocaine, the report found. “And I’ve yet to see a peak,” said one of the co-authors, Eric Dawson, vice president of clinical affairs at Millennium Health, a specialty laboratory that provides drug testing services to monitor use of prescription medications and illicit drugs.

The report, which takes a deep dive into the nation’s drug trends and breaks usage patterns down by region, is based on 4.1 million urine samples collected from January 2013 to December 2023 from people receiving some kind of drug addiction care.

Its findings offer staggering statistics and insights. Its major finding: how common polysubstance use has become. According to the report, an overwhelming majority of fentanyl-positive urine samples — nearly 93% — contained additional substances. “And that is huge,” said Nora Volkow, director of the National Institute on Drug Abuse at the National Institutes of Health.

Author(s): Colleen DeGuzman

Publication Date: 21 Feb 2024

Publication Site: KFF Health News

Trends in Mandatory Spending

Link:https://crsreports.congress.gov/product/pdf/R/R44641

Graphic:

Excerpt:

In FY2023, mandatory spending accounts for an estimated 63% of total federal spending. Social Security alone accounts for about 21% of federal spending. Medicare and the federal share of Medicaid together account for another 25% of federal spending. Therefore, spending on Social Security, Medicare, and Medicaid now makes up almost half of total federal spending.

These figures do not reflect the implicit cost of tax expenditures, which are revenue losses attributable to provisions of the federal tax laws that allow a special exclusion, exemption, or deduction from gross income or provide a special credit, a preferential tax rate, or a deferral of tax liability.8 As with mandatory spending, tax policy is not controlled by annual appropriations acts, but by other types of legislation.

Author(s): Congressional Research Service

Publication Date: last updated 7 Nov 2023

Publication Site: U.S. Congress

The Little Book of Data 6

Link: https://www.avivainvestors.com/en-gb/views/aiq-investment-thinking/little-book-of-data/

Graphic:

Excerpt:

The sixth edition of The Little Book of Data presents original and curated visuals, charts and graphics to offer a fresh perspective on topics shaping our world, including climate change, artificial intelligence, inflation, economics and geopolitics.

Author(s): Aviva Investors

Publication Date: October 2023

Publication Site: Aviva