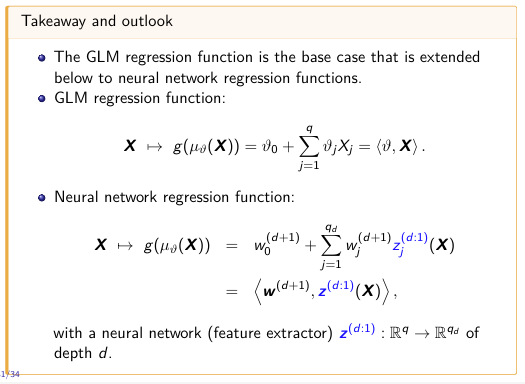
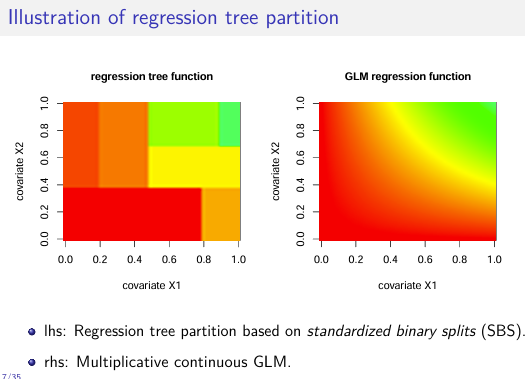
This project aims to empower the actuarial profession with modern machine learning and AI tools. We provide comprehensive teaching materials that consist of lecture notes (technical document) building the theoretical foundation of this initiative. Each chapter of these lecture notes is supported by notebooks and slides which give teaching material, practical guidance and applied examples. Moreover, hands-on exercises in both R and Python are provided in additional notebooks.
Author(s): Mario V. Wüthrich, Ronald Richman, Benjamin Avanzi, Mathias Lindholm, Michael Mayer, Jürg Schelldorfer, Salvatore Scognamiglio
The Society of Actuaries (SOA) Research Institute’s Mortality and Longevity Strategic Research Program Steering Committee issued a call for essays to explore the application of artificial intelligence (AI) to mortality and longevity. The objective was to gather a variety of perspectives and experiences on the use of AI in mortality modeling, forecasting and prediction to promote discussion and future research around this topic.
The collection includes six essays that were accepted for publication from all submissions. Two essays were chosen for prizes based on their creativity, originality, and likelihood of further thought on the subject matter.
Author(s): multiple
Publication Date: September 2024
Publication Site: Society of Actuaries, SOA Research Institute
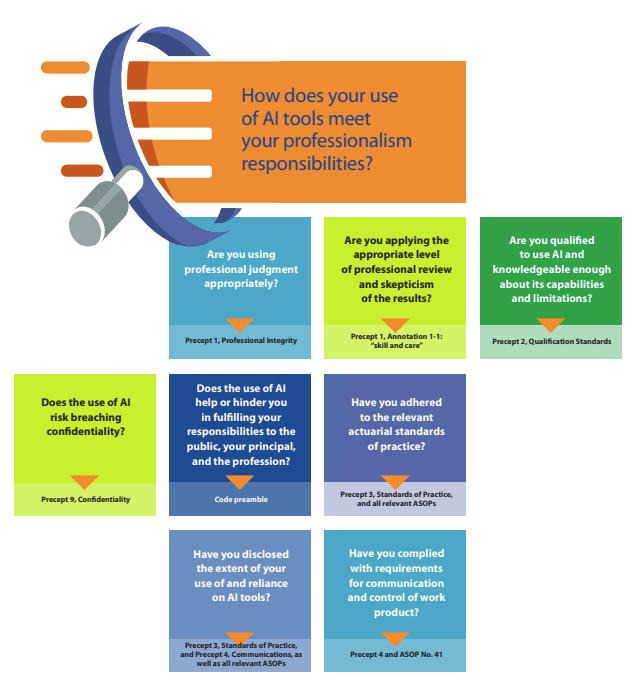
This paper describes the use and professionalism considerations for actuaries using generative artificial intelligence (GenAI) to provide actuarial services. GenAI generates text, quantitative, or image content based on training data, typically using a large language model (LLM). Examples of GenAI deployments include Open AI GPT, Google Gemini, Claude, and Meta. GenAI transforms information acquired from training data into entirely new content. In contrast, predictive AI models analyze historical quantitative data to forecast future outcomes, functioning like traditional predictive statistical models.
Actuaries have a wide range of understanding of AI. We assume the reader is broadly familiar with AI and AI model capabilities, but not necessarily a designer or expert user. In this paper, the terms “GenAI,” “AI,” “AI model(s),” and “AI tool(s)” are used interchangeably. This paper covers the professionalism fundamentals of using GenAI and only briefly discusses designing, building, and customizing GenAI systems. This paper focuses on actuaries using GenAI to support actuarial conclusions, not on minor incidental use of AI that duplicates the function of tools such as plug-ins, co-pilots, spreadsheets, internet search engines, or writing aids.
GenAI is a recent development, but the actuarial professionalism framework helps actuaries use GenAI appropriately: the Code of Professional Conduct, the Qualification Standards for Actuaries Issuing Statements of Actuarial Opinion in the United States (USQS), and the actuarial standards of practice (ASOPs). Although ASOP No. 23, Data Quality; No. 41, Actuarial Communications; and No. 56, Modeling, were developed before GenAI was widely available, each applies in situations when GenAI may now be used. The following discussion comments on these topics, focusing extensively on the application of ASOP No. 56, which provides guidance for actuaries when they are designing, developing, selecting, modifying, using, reviewing, or evaluating models. GenAI is a model; thus ASOP No. 56 applies.
The paper explores use cases and addresses conventional applications, including quantitative and qualitative analysis, as of mid-2024, rather than anticipating novel uses or combinations of applications. AI tools change quickly, so the paper focuses on principles rather than the technology. The scope of this paper does not include explaining how AI models are structured or function, nor does it offer specific guidelines on AI tools or use by the actuary in professional settings. Given the rapid rate of change within this space, the paper makes no predictions about the rapidly evolving technology, nor does it speculate on future challenges to professionalism.
Author(s): Committee on Professional Responsibility of the American Academy of Actuaries
Committee on Professional Responsibility Geoffrey C. Sandler, Chairperson Brian Donovan Richard Goehring Laura Maxwell Shawn Parks Matthew Wininger Kathleen Wong Yukki Yeung Paul Zeisler Melissa Zrelack
Artificial Intelligence Task Force Prem Boinpally Laura Maxwell Shawn Parks Fei Wang Matt Wininger Kathy Wong Yukki Yeung
Here are several examples of ChatBots and other AI applications for actuaries to try.
Answers that you might get from a general AI LLM such as ChatGPT may or may not correctly represent the latest thinking in actuarial science. These chatBots make an effort to educate the LLM with actuarial or other pertinent literature so that you can get better informed answers.
But, you need to be a critical user. Please be careful with the responses that you get from these ChatBots and let us know if you find any issues. This is still early days for the use of AI in actuarial practice and we need to learn from our experiences and move forward.
Note from meep: there are multiple Apps/Bots linked from the main site.
The NAIC has developed its definition of AI, and the insurance industry has responded with information in accordance with that definition. Any definition developed by Treasury should align with, or at a minimum not conflict with, definitions of AI in existing regulatory frameworks for financial institutions.
The Treasury definition of AI should reflect the following: o Definitions should be tailored to the different types of AI and the use cases and risks they pose. The definition used in this RFI is similar to an outdated definition put forth by the Organization for Economic Coordination and Development (OECD), which could be narrowed for specific use cases (e.g., tiering of risks under the EU framework). o There are also distinctions between generative AI used to make decisions, without ultimately including human input or intervention, and AI used with human decisionmaking being absolute or the usage being solely for internal efficiencies and therefore not impactful for customers. o AI covers a broad range of predictive modeling techniques that would otherwise not be considered Artificial Intelligence. A refinement to the definition that classifies AI as machine learning systems that utilize artificial neural networks to make predictions may be more appropriate. o The definition of AI should exclude simpler computation tasks that companies have been using for a long time.
The U.S. Department of the Treasury (Treasury) is seeking comment through this request for information (RFI) on the uses, opportunities and risks presented by developments and applications of artificial intelligence (AI) within the financial sector. Treasury is interested in gathering information from a broad set of stakeholders in the financial services ecosystem, including those providing, facilitating, and receiving financial products and services, as well as consumer and small business advocates, academics, nonprofits, and others.
DATES:
Written comments and information are requested on or before August 12, 2024.
….
Oversight of AI—Explainability and Bias
The rapid development of emerging AI technologies has created challenges for financial institutions in the oversight of AI. Financial institutions may have an incomplete understanding of where the data used to train certain AI models and tools was acquired and what the data contains, as well as how the algorithms or structures are developed for those AI models and tools. For instance, machine-learning algorithms that internalize data based on relationships that are not easily mapped and understood by financial institution users create questions and concerns regarding explainability, which could lead to difficulty in assessing the conceptual soundness of such AI models and tools.[22]
Financial regulators have issued guidance on model risk management principles, encouraging financial institutions to effectively identify and mitigate risks associated with model development, model use, model validation (including validation of vendor and third-party models), ongoing monitoring, outcome analysis, and model governance and controls.[23] These principles are technology-agnostic but may not be applicable to certain AI models and tools. Due to their inherent complexity, however, AI models and tools may exacerbate certain risks that may warrant further scrutiny and risk mitigation measures. This is particularly true in relation to the use of emerging AI technologies.
Furthermore, the rapid development of emerging AI technologies may create a human capital shortage in financial institutions, where sufficient knowledge about a potential risk or bias of those AI technologies may be lacking such that staff may not be able to effectively manage the development, validation, and application of those AI technologies. Some financial institutions may rely on third-party providers to develop and validate AI models and tools, which may also create challenges in ensuring alignment with relevant risk management guidance.
Challenges in explaining AI-assisted or AI-generated decisions also create questions about transparency generally, and raise concerns about the potential obfuscation of model bias that can negatively affect impacted entities. In the Non-Bank Report, Treasury noted the potential for AI models to perpetuate discrimination by utilizing and learning from data that reflect and reinforce historical biases.[24] These challenges of managing explainability and bias may impede the adoption and use of AI by financial institutions.
When and how should text-generating artificial intelligence (AI) programs such as ChatGPT help write research papers? In the coming months, 4000 researchers from a variety of disciplines and countries will weigh in on guidelines that could be adopted widely across academic publishing, which has been grappling with chatbots and other AI issues for the past year and a half. The group behind the effort wants to replace the piecemeal landscape of current guidelines with a single set of standards that represents a consensus of the research community.
Known as CANGARU, the initiative is a partnership between researchers and publishers including Elsevier, Springer Nature, Wiley; representatives from journals eLife, Cell, and The BMJ; as well as industry body the Committee on Publication Ethics. The group hopes to release a final set of guidelines by August, which will be updated every year because of the “fast evolving nature of this technology,” says Giovanni Cacciamani, a urologist at the University of Southern California who leads CANGARU. The guidelines will include a list of ways authors should not use the large language models (LLMs) that power chatbots and how they should disclose other uses.
Since generative AI tools such as ChatGPT became public in late 2022, publishers and researchers have debated these issues. Some say the tools can help draft manuscripts if used responsibly—by authors who do not have English as their first language, for example. Others fear scientific fraudsters will use them to publish convincing but fake work quickly. LLMs’ propensity to make things up, combined with their relative fluency in writing and an overburdened peer-review system, “poses a grave threat to scientific research and publishing,” says Tanya De Villiers-Botha, a philosopher at Stellenbosch University.
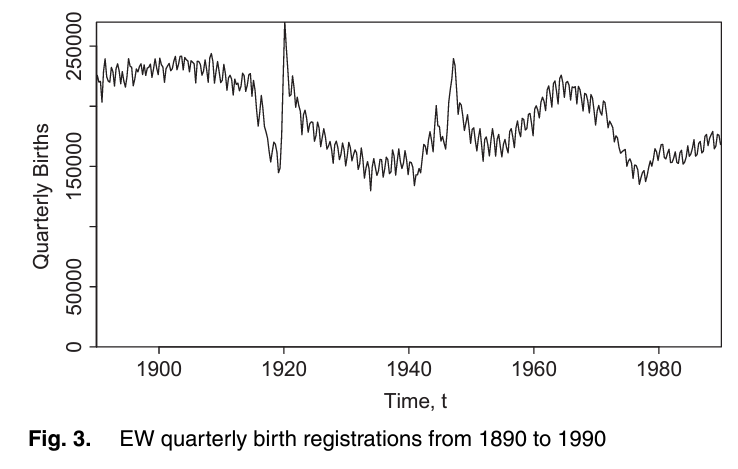
The analysis of national mortality trends is critically dependent on the quality of the population, exposures and deaths data that underpin death rates. We develop a framework that allows us to assess data reliability and to identify anomalies, illustrated, by way of example, using England and Wales population data. First, we propose a set of graphical diagnostics that help to pinpoint anomalies. Second, we develop a simple Bayesian model that allows us to quantify objectively the size of any anomalies. Two-dimensional graphical diagnostics and modelling techniques are shown to improve significantly our ability to identify and quantify anomalies. An important conclusion is that significant anomalies in population data can often be linked to uneven patterns of births of people in cohorts born in the distant past. In the case of England and Wales, errors of more than 9% in the estimated size of some birth cohorts can be attributed to an uneven pattern of births. We propose methods that can use births data to improve estimates of the underlying population exposures. Finally, we consider the effect of anomalies on mortality forecasts and annuity values, and we find significant effects for some cohorts. Our methodology has general applicability to other sources of population data, such as the Human Mortality Database.
Keywords: Baby boom;Cohort–births–deaths exposures methodology; Convexity adjustment ratio; Deaths; Graphical diagnostics; Population data
Author(s): Andrew J.G.Cairns, Heriot-Watt University, Edinburgh, UK David Blake, Cass Business School, London, UK Kevin Dowd Durham University Business School, UK and Amy R. Kessler Prudential Retirement, Newark, USA
Publication Date: 2016
Publication Site: Journal of the Royal Statistical Society
J. R. Statist. Soc. A (2016) 179, Part 4, pp. 975–1005
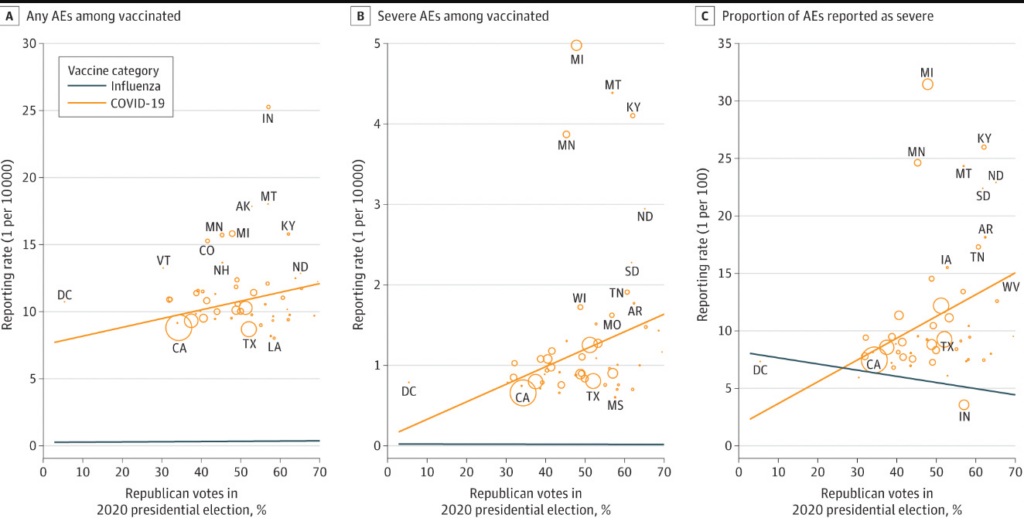
Now let’s turn to the paper. Here is what the authors find (weak correlation btw voting and vaccine injuries) , and here are the issues.
These data are ecological. It doesn’t prove that republicans themselves are more likely to report vaccine injuries. It would not be difficult to pair voting records with vaccine records at an individual patient level if the authors wished to do it right— another example of research laziness.
What if republicans actually DO have more vaccine injuries? The authors try to correct for the fact by adjusting for influenza adverse events.
Let me explain why this is a poor choice. The factors that predict whether someone has an adverse event to influenza vaccine may not be the same as those that predict adverse events from covid shots. It could be that there are actually more covid vaccine injuries in one group than another— even though both had equal rates of influenza injuries.
Another way to think of it is, there can be two groups of people and you can balance them by the rate with which they get headaches from drinking wine, but one group can be more likely to get headaches from reading without glasses because more people in that group wear glasses. In other words, states with more republicans might be states with specific co-morbidities that predict COVID vaccine adverse side effects but not influenza vaccine side effects. We already know that COVID vaccine injuries do affect different groups (young men, for e.g.).
Author(s): Vinay Prasad
Publication Date: 2 Apr 2024
Publication Site: Vinay Prasad’s Thoughts and Observations at substack
A Harvard University probe into prominent researcher Francesca Gino found that her work contained manipulated data and recommended that she be fired, according to a voluminous court filing that offers a rare behind-the-scenes look at research misconduct investigations.
It is a key document at the center of a continuing legal fight involving Gino, a behavioral scientist who in August sued the university and a trio of data bloggers for $25 million.
The case has captivated researchers and the public alike as Gino, known for her research into the reasons people lie and cheat, has defended herself against allegations that her work contains falsified data.
The investigative report had remained secret until this week, when the judge in the case granted Harvard’s request to file the document, with some personal details redacted, as an exhibit.
….
An initial inquiry conducted by two HBS faculty included an examination of the data sets from Gino’s computers and records, and her written responses to the allegations. The faculty members concluded that a full investigation was warranted, and Datar agreed.
In the course of the full investigation, the two faculty who ran the initial inquiry plus a third HBS faculty member interviewed Gino and witnesses who worked with her or co-wrote the papers. They gathered documents including data files, correspondence and various drafts of the submitted manuscripts. And they commissioned an outside firm to conduct a forensic analysis of the data files.
The committee concluded that in the various studies, Gino edited observations in ways that made the results fit hypotheses.
When asked by the committee about work culture at the lab, several witnesses said they didn’t feel pressured to obtain results. “I never had any indication that she was pressuring people to get results. And she never pressured me to get results,” one witness said.