Antique Insurance and Actuarial Books

Link: https://thetermguy.ca/books.html

Graphic:

Excerpt:

The Term Guy’s hobby is collecting antique insurance books.  Here we’ve scanned many of our out of copyright books for your enjoyment and perhaps research purposes. Stay tuned, more books coming as I have time to scan them!

We have extracted table data from many of these books and made the information available as excel spreadsheets. In the download of spreadsheets we have also included a high def image of each of the pages containing the tables. The image filename for each page and the excel spreadsheet have the same name, i.e. image0001.jpg.xlxs contains table data from image0001.jpg. You may download and use the data unrestricted, but we would ask that you consider giving us a link from your website so that others can find this information as well.

Author(s):

Publication Date:

Publication Site:

GUN VIOLENCE ARCHIVE

Link: https://www.gunviolencearchive.org/

Graphic:

Excerpt:

PUBLISHED DATE: April 20, 2023

Gun violence  and crime incidents are collected/validated from 7,500 sources daily – Incident Reports and their source data are found at the gunviolencearchive.org website.

Footnotes

  1. Number of source verified deaths and injuries
  2. Number of INCIDENTS reported and verified
  3. Calculation based on CDC Suicide Data
  4. Actual total of all non-suicide deaths plus daily calculated suicide deaths

All numbers are subject to change or incidents recategorized as new evidence is established and verified.

METHODOLOGY & DEFINITIONS AVAILABLE AT:
https://www.gunviolencearchive.org/methodology

www.gunviolencearchive.org
www.facebook.com/gunviolencearchive
On Twitter @gundeaths

Publication Date: accessed 20 April 2023

Publication Site: Gun Violence Archive

(Updated) New Hong Kong Watch report finds that MSCI investors are at risk of passively funding crimes against humanity in Xinjiang

Link: https://www.hongkongwatch.org/all-posts/2022/12/5/updated-new-hkw-report-finds-that-msci-investors-are-at-risk-of-passively-funding-crimes-against-humanity-in-xinjiang

Report PDF: https://static1.squarespace.com/static/58ecfa82e3df284d3a13dd41/t/638e318e6697c029da8e5c38/1670263209080/EDITED+REPORT+5+DEC.pdf

Graphic:

Excerpt:

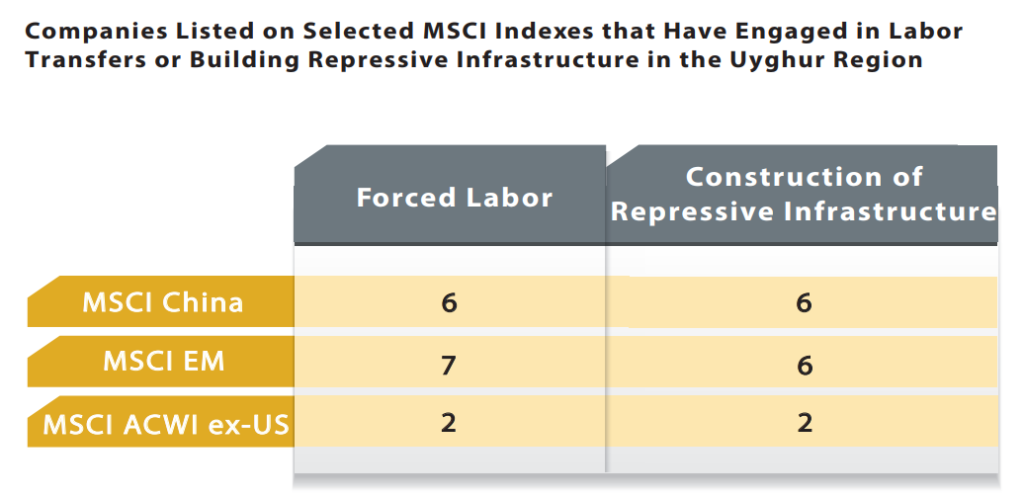
A new report by Hong Kong Watch have found that a number of pension funds may be passively invested in at least 13 China based companies where there is credible evidence of involvement in Uyghur forced labour programs and construction of internment camps in Xinjiang.

 As part of the report, Hong Kong Watch found that major asset managers are exposed passively to these companies as a result of their inclusion on Morgan Stanley Capital International’s Emerging Markets Index, China Index and All World Index ex-USA.  

….

Commenting on the release of the report, Johnny Pattersonco-founder and a research fellow at Hong Kong Watch, said:

“13 companies on MSCI’s emerging markets index are either known to have directly used forced labour through China’s forcible transfer of Uyghurs, or been involved in the construction of camps. Given this Index is the most widely tracked Emerging Markets index in the world, it raises serious questions about how seriously international financial institutions take their international human rights obligations or the ‘S’ in ESG.

Our view is that firms known to use modern slavery or known to be complicit in crimes against humanity should be classed alongside tobacco as ‘sin stocks’, or stocks which investors do not touch. Governments have a duty to signal which firms are unacceptable, but international financial institutions must also be doing their full due diligence. It is unacceptable that enormous amounts of the money of ordinary pensioners and retail investors is being passively channelled into firms that are known to use forced labour.” 

Publication Date: 5 Dec 2022

Publication Site: Hong Kong Watch

Inflation Around the World: How Does the US Compare to Canada and the EU?

Link: https://mishtalk.com/economics/inflation-around-the-world-how-does-the-us-compare-to-canada-and-the-eu

Graphic:

Excerpt:

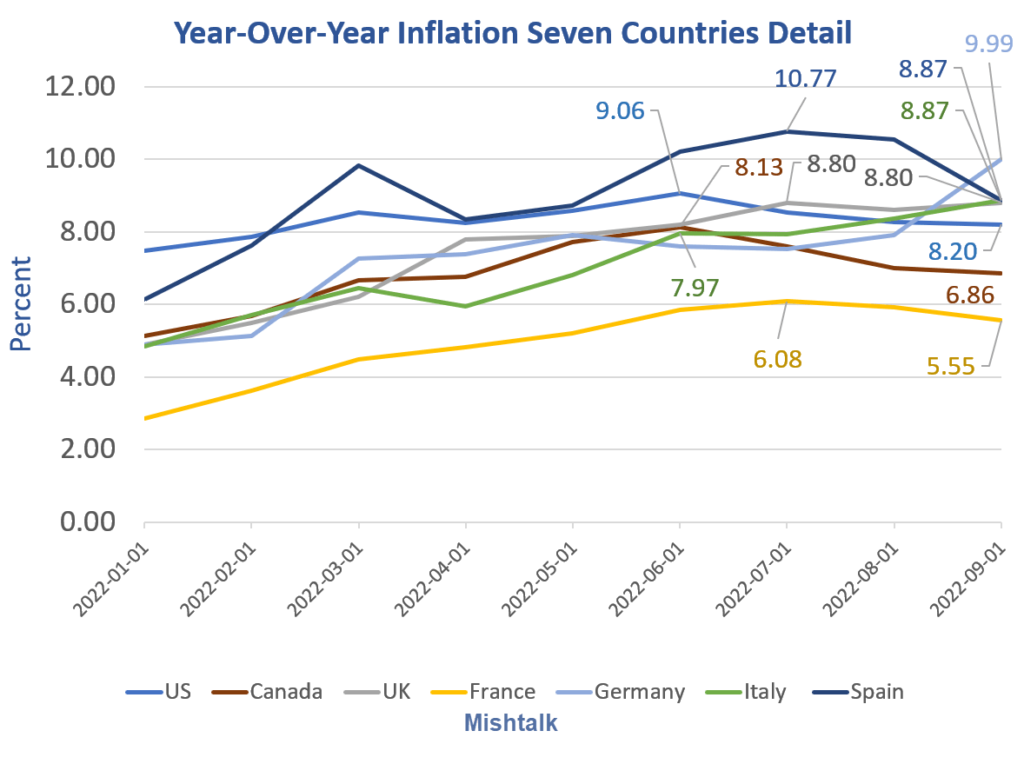
  • Inflation in the US was the first to peak.
  • US inflation peaked in June at 9.06 percent and is currently (through September) at  8.20 percent.
  • Inflation in France peaked at the lowest rate, 6.08 percent.
  • France also has the lowest current rate of 5.55 percent.  
  • Inflation in Germany is 9.99 percent and still rising
  • Inflation in Italy is 8.87 percent and still rising
  • Inflation in Spain was the highest peak so far at 10.77 percent
  • Inflation in the UK is 8.80 percent matching the July high.
  • Inflation in Canada peaked at 8.13 percent and is now 6.86 percent

Author(s): Mike Shedlock

Publication Date: 3 Dec 2022

Publication Site: Mish Talk

All of US: a dot density map of the United States

Link: https://all-of-us.benschmidt.org/

Graphic:

Excerpt:

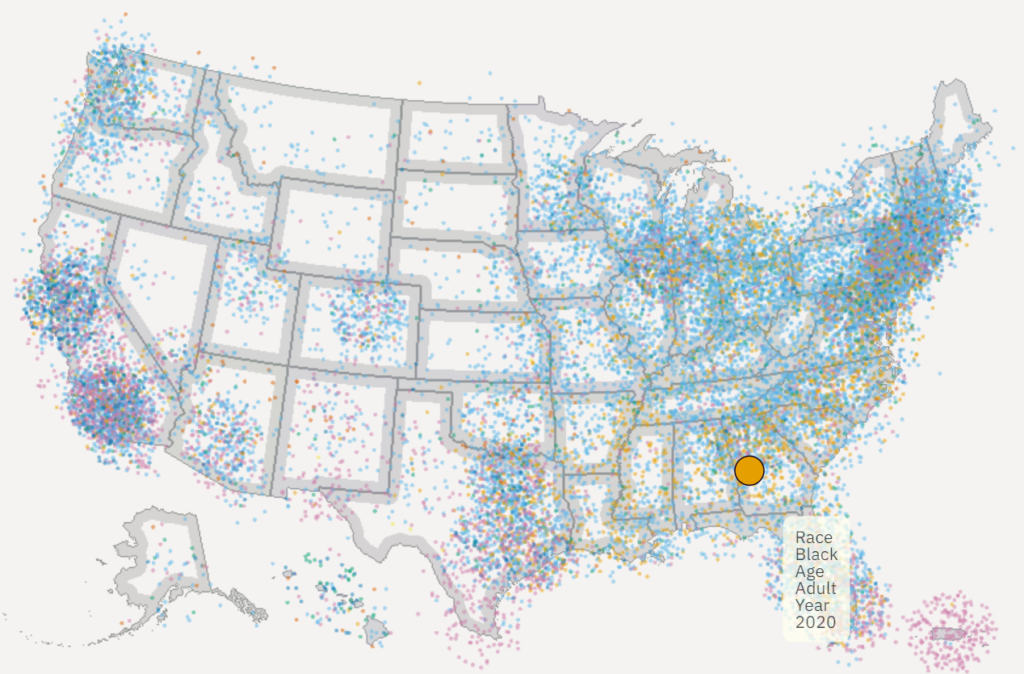
One point per person in the US for the 2010 and 2020 censuses, fully zoomable and interactive using WebGL and [Deepscatter](https://github.com/CreatingData/deepscatter). Since this uses WebGL individual point rendering and quadtiled data, it can be far more responsive than raster-based maps you may have seen in 2010. Plus, if you zoom all the way in in some views it has little person glyphs!

Author(s): Ben Schmidt

Publication Date: accessed 2 Dec 2022

Publication Site: Ben Schmidt’s personal site

Public Sector Pensions in the United States

Link: https://eh.net/encyclopedia/public-sector-pensions-in-the-united-states/

Excerpt:

Although employer-provided retirement plans are a relatively recent phenomenon in the private sector, dating from the late nineteenth century, public sector plans go back much further in history. From the Roman Empire to the rise of the early-modern nation state, rulers and legislatures have provided pensions for the workers who administered public programs. Military pensions, in particular, have a long history, and they have often been used as a key element to attract, retain, and motivate military personnel. In the United States, pensions for disabled and retired military personnel predate the signing of the U.S. Constitution.

Like military pensions, pensions for loyal civil servants date back centuries. Prior to the nineteenth century, however, these pensions were typically handed out on a case-by-case basis; except for the military, there were few if any retirement plans or systems with well-defined rules for qualification, contributions, funding, and so forth. Most European countries maintained some type of formal pension system for their public sector workers by the late nineteenth century. Although a few U.S. municipalities offered plans prior to 1900, most public sector workers were not offered pensions until the first decades of the twentieth century. Teachers, firefighters, and police officers were typically the first non-military workers to receive a retirement plan as part of their compensation.

By 1930, pension coverage in the public sector was relatively widespread in the United States, with all federal workers being covered by a pension and an increasing share of state and local employees included in pension plans. In contrast, pension coverage in the private sector during the first three decades of the twentieth century remained very low, perhaps as low as 10 to 12 percent of the labor force (Clark, Craig, and Wilson 2003). Even today, pension coverage is much higher in the public sector than it is in the private sector. Over 90 percent of public sector workers are covered by an employer-provided pension plan, whereas only about half of the private sector work force is covered (Employee Benefit Research Institute 1997).

Author(s): Lee A. Craig, North Carolina State University

Publication Date: 16 March 2003, accessed 8 Oct 2022

Publication Site: EH.Net Encyclopedia

Citation: Craig, Lee. “Public Sector Pensions in the United States”. EH.Net Encyclopedia, edited by Robert Whaples. March 16, 2003. URL http://eh.net/encyclopedia/public-sector-pensions-in-the-united-states/

Polio Is Back in the US and UK. Here’s How That Happened

Link: https://www.wired.com/story/polio-is-back-in-the-us-and-uk-heres-how-that-happened/

Excerpt:

Start with the vaccine formula—or formulas, actually, because there are two. They were born from a ferocious mid-20th century rivalry between scientists Jonas Salk and Albert Sabin. Salk’s formula, the first to be approved, is injected; it uses an inactivated version of the virus, and protects against developing disease, but does not stop viral transmission. Sabin’s formula, which came a few years later, used an artificially-weakened live virus. It does block transmission, and—because it is a liquid that gets squirted into a child’s mouth—it is cheaper to make and easier to distribute, since it doesn’t require trained healthcare workers or careful disposal of needles. Those qualities made the Sabin oral version, known as OPV, the bulwark of polio control, and eventually the main weapon in the global eradication campaign.

The oral vaccine had a unique benefit. Wild-type polio is actually a gut virus: It locks onto receptors in the intestinal lining and replicates there before migrating to the nerve cells that control muscles. But because it’s in the gut, it also passes out of the body in feces and then spreads to other people in contaminated water. The Sabin vaccine takes advantage of that process: The vaccine virus replicates in a child, gets pooped out, and spreads its protection to unvaccinated neighbors.

Yet that benefit concealed a tragic flaw. Once out of every several million doses, the weakened virus reverted to the neurovirulence of the wild type, destroying those motor neurons and causing polio paralysis. That mutation would also make a child who harbored the reverted virus a potential source of infection, rather than protection. That risk is what caused rich nations to abandon the oral version: In 1996, when wild polio was no longer occurring in the US, the oral vaccine caused about 10 cases of polio paralysis in children. The US switched to the injectable formula, known as IPV, in 2000, and the UK followed in 2004.

Polio vaccination requires several doses to create full protection, and once that occurs, children are protected against both wild-type and vaccine-derived versions of the virus. So the international vaccination campaign continued to rely on OPV, arguing that the risk would diminish as more children received protection. That was a reasonable gamble when the effort was new and health authorities thought it would take 10 to 12 years to achieve eradication. But thanks to funding shortfalls, political and religious unrest, and the Covid pandemic—which imposed a slowdown not just on eradication activities but on all childhood vaccines—it’s now been 34 years, and the job is not done. Meanwhile, last year in 20 countries there were a total of 688 cases of paralysis of what’s called “circulating vaccine-derived poliovirus,” and only six cases of wild-type polio, in three nations.

Author(s): MARYN MCKENNA

Publication Date: 24 Aug 2022

Publication Site: Wired

2020-2021 Excess Deaths in the U.S. General Population by Age and Sex

Link: https://www.soa.org/resources/research-reports/2022/excess-death-us/

Full report: https://www.soa.org/4a55a7/globalassets/assets/files/resources/research-report/2022/excess-death-us.pdf

Graphic:

Excerpt:

The data used for this analysis was provided by the CDC as of August 17, 2022 and includes incurred deaths
by week, beginning on December 29, 2019 and going through July 2, 2022. For 2020, the CDC defines Week
1 as ranging from December 29, 2019 through January 4, 2020 and Week 52 as ranging from December 19,
2020 through December 26, 2020, so when reporting on 2020 results, this convention is used. The year
2021 begins on December 27, 2020 and runs through January 2, 2022. For the purposes of this analysis, the
start of the COVID-19 active period is March 22, 2020.
Due to the delay in reporting, the actual deaths have been completed based on factors that vary by age
and sex. These are shown below along with the expectations that are based on the five-year trend after
adjusting for seasonality.

These data are as of August 17, 2022 and exclude deaths that occurred after July 2, 2022. Figure 1 shows
that, for most months, the total A/E ratio is much greater than 100%, while the A/E ratio excluding COVID19 deaths is also greater than 100% by a few percent.

Author(s): Rick Leavitt, ASA, MAAA

Publication Date: August 2022

Publication Site: Society of Actuaries Research Institute

5 Worst States for Working-Age Death Increases in July

Link: https://www.thinkadvisor.com/2022/09/12/5-worst-states-for-working-age-death-increases-in-july/

Graphic:

Excerpt:

Early government mortality numbers show that the number of U.S. deaths has stayed very high this summer, both for members of the general population and for working-age people.

For all U.S. residents, for the period from July 3 through Aug. 27, the number of deaths recorded in the U.S. Centers for Disease Control and Prevention’s FluView reports was 426,881, according to the report released Friday, which included data sent to the CDC by Sept. 3.

The “all cause” total for the general population was down just 0.8% from the total for the comparable period in 2021, and it was 22% higher than the total for the comparable period in 2019, before the COVID-19 pandemic began.

For U.S. residents ages 25 through 64, the all-cause death total during that same period was 113,665, according to early, weighted data in the CDC’s Weekly Counts of Deaths by Jurisdiction and Age reports, as of Sept. 8.

Author(s): Allison Bell

Publication Date: 12 Sept 2022

Publication Site: Think Advisor

Tracking covid-19 excess deaths across countries

Link: https://www.economist.com/graphic-detail/coronavirus-excess-deaths-tracker?utm_campaign=a.coronavirus-special-edition&utm_medium=email.internal-newsletter.np&utm_source=salesforce-marketing-cloud&utm_term=2022042&utm_content=ed-picks-article-link-5&etear=nl_special_5&utm_campaign=a.coronavirus-special-edition&utm_medium=email.internal-newsletter.np&utm_source=salesforce-marketing-cloud&utm_term=4/2/2022&utm_id=1119326

Graphic:

Excerpt:

As covid-19 has spread around the world, people have become grimly familiar with the death tolls that their governments publish each day. Unfortunately, the total number of fatalities caused by the pandemic may be even higher, for several reasons. First, the official statistics in many countries exclude victims who did not test positive for coronavirus before dying—which can be a substantial majority in places with little capacity for testing. Second, hospitals and civil registries may not process death certificates for several days, or even weeks, which creates lags in the data. And third, the pandemic has made it harder for doctors to treat other conditions and discouraged people from going to hospital, which may have indirectly caused an increase in fatalities from diseases other than covid-19.

One way to account for these methodological problems is to use a simpler measure, known as “excess deaths”: take the number of people who die from any cause in a given region and period, and then compare it with a historical baseline from recent years. We have used statistical models to create our baselines, by predicting the number of deaths each region would normally have recorded in 2020 and 2021.

Many Western countries, and some nations and regions elsewhere, regularly publish data on mortality from all causes. The table below shows that, in most places, the number of excess deaths (compared with our baseline) is greater than the number of covid-19 fatalities officially recorded by the government. The full data for each country, as well as our underlying code, can be downloaded from our GitHub repository. Our sources also include the Human Mortality Database, a collaboration between UC Berkeley and the Max Planck Institute in Germany, and the World Mortality Dataset, created by Ariel Karlinsky and Dmitry Kobak.

Publication Date: last updated 13 May 2022

Publication Site: The Economist

Personal Income Rose in 2021, But Growth Varied by State

Link: https://www.pewtrusts.org/en/research-and-analysis/articles/2022/05/13/personal-income-rose-in-2021-but-growth-varied-by-state

Graphic:

Excerpt:

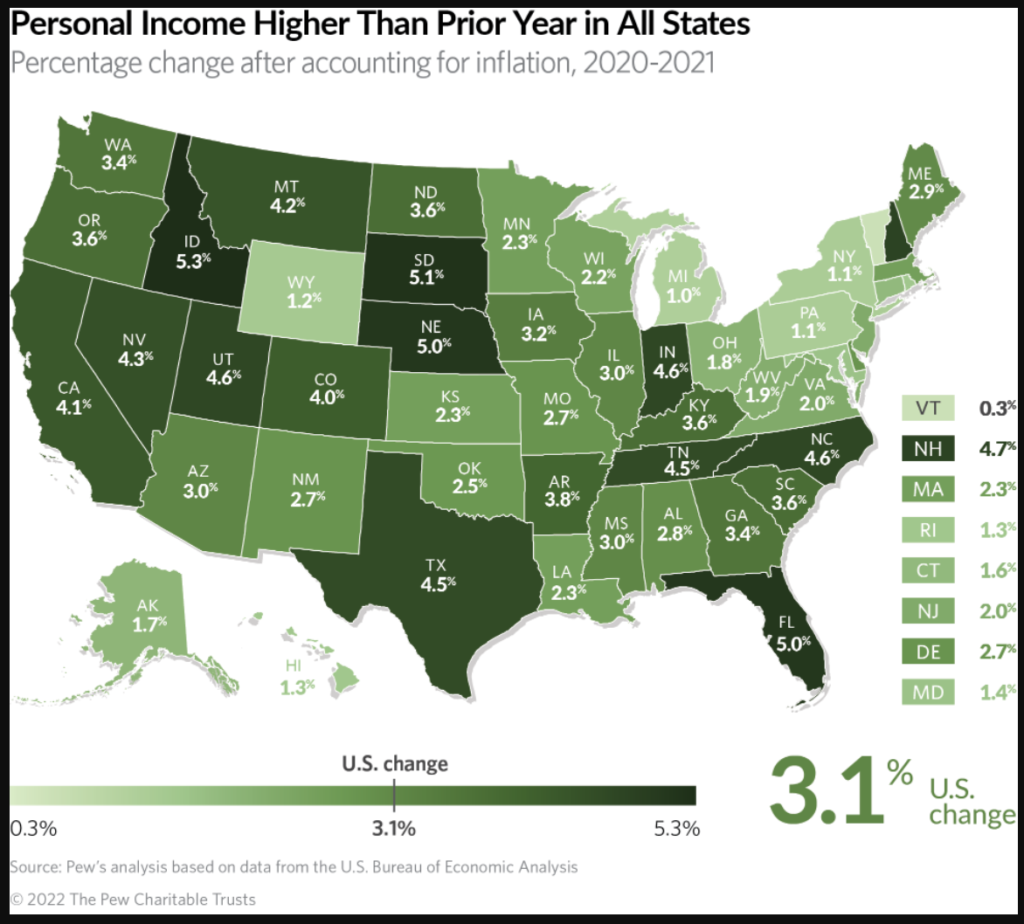
Total personal income climbed in every state during the second year of the COVID-19 pandemic as the economy continued to recover, with Idaho and South Dakota experiencing the strongest gains. Americans’ earnings from work, which account for the bulk of personal income, recorded the sharpest annual increase in over two decades. Federal aid and other public assistance also added to states’ gains, surpassing 2020’s elevated levels.

Total personal income rose across states in 2021 as the economy largely followed an upward trajectory after severe losses early in the pandemic. Nationally, the sum of personal income from all sources was up 3.1% from 2020, after accounting for inflation.

Author(s): Mike Maciag, Joanna Biernacka-Lievestro & Joe Fleming

Publication Date: 13 May 2022

Publication Site: Pew Trust