Link: https://all-of-us.benschmidt.org/
Graphic:

Excerpt:
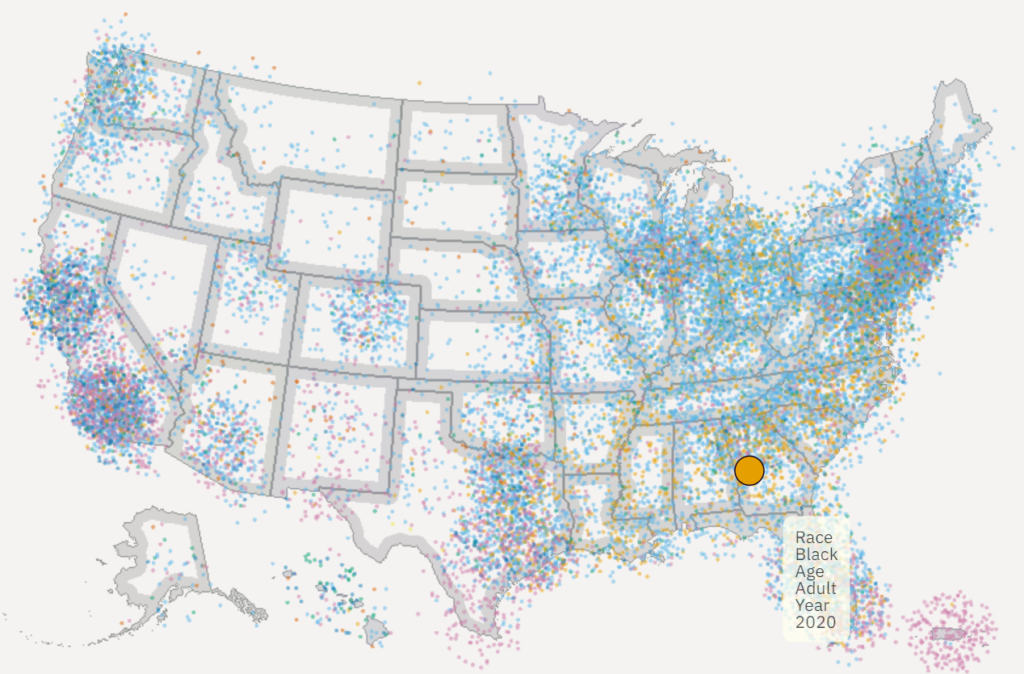
One point per person in the US for the 2010 and 2020 censuses, fully zoomable and interactive using WebGL and [Deepscatter](https://github.com/CreatingData/deepscatter). Since this uses WebGL individual point rendering and quadtiled data, it can be far more responsive than raster-based maps you may have seen in 2010. Plus, if you zoom all the way in in some views it has little person glyphs!
Author(s): Ben Schmidt
Publication Date: accessed 2 Dec 2022
Publication Site: Ben Schmidt’s personal site