Link: https://www.sfchronicle.com/projects/2023/maps-migration/
Tweet:
Graphic:
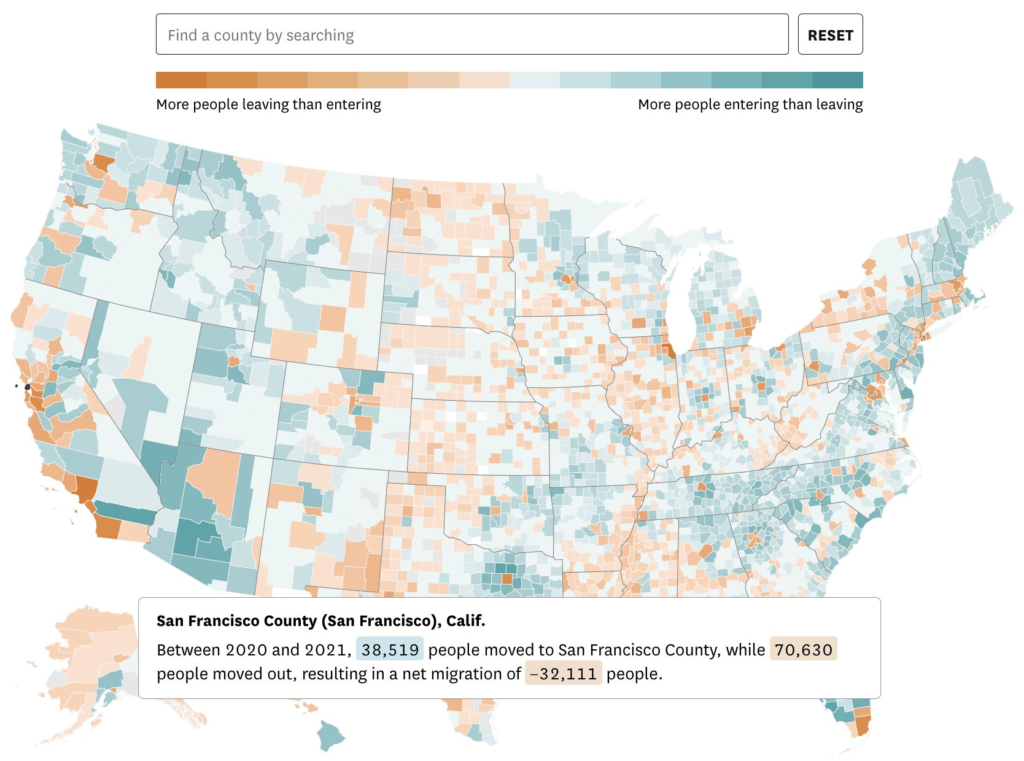
Author(s): Nami Sumida
Publication Date: 2 Jun 2023 (also 31 May 2023) accessed 7 Jun 2023
Publication Site: San Francisco Chronicle
All about risk
Link: https://www.sfchronicle.com/projects/2023/maps-migration/
Tweet:
Graphic:
Author(s): Nami Sumida
Publication Date: 2 Jun 2023 (also 31 May 2023) accessed 7 Jun 2023
Publication Site: San Francisco Chronicle
Graphic:
Excerpt:
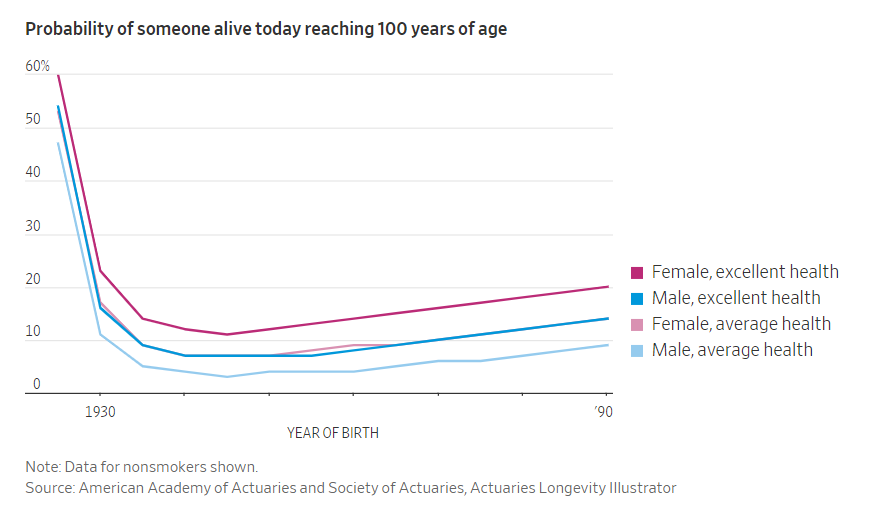
Demographers and actuaries make the following distinction between life expectancy and longevity: Life expectancy refers to the average number of years someone will live from a given age, whereas longevity refers to how long he or she might live if everything goes well, typically expressed as the probability of living beyond a certain age such as 85, 90 or even 100.
A growing body of evidence shows that many people are ignorant of their so-called longevity risk—the probability of living a very long time—and the complications that presents.
….
Drs. Hurwitz and Mitchell note that retirement calculators provide information about average life expectancy, but not longevity. They have found that about five times as many Census Bureau publications relate to life expectancy as longevity. Thus, people who have planned appropriately for their life expectancy might miss how likely they are to live longer.
….
People can look up their longevity risk with an online Longevity Illustrator maintained by the American Academy of Actuaries and Society of Actuaries, based off the latest mortality data from the Social Security Administration.
Author(s): Josh Zumbrun
Publication Date: 10 Feb 2023
Publication Site: WSJ
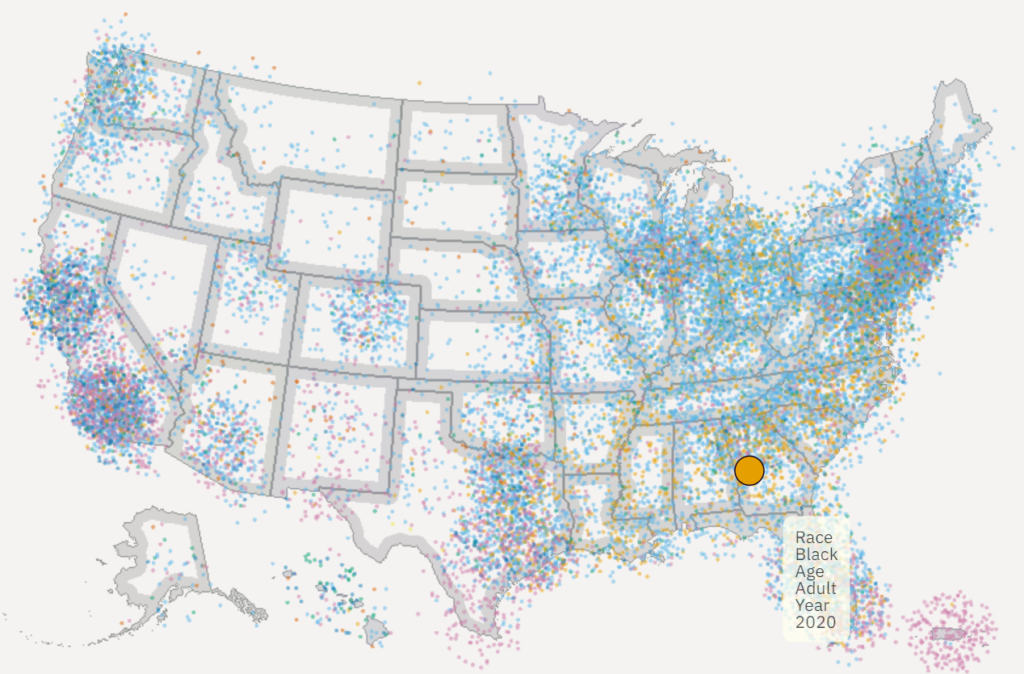
Link: https://all-of-us.benschmidt.org/
Graphic:
Excerpt:
One point per person in the US for the 2010 and 2020 censuses, fully zoomable and interactive using WebGL and [Deepscatter](https://github.com/CreatingData/deepscatter). Since this uses WebGL individual point rendering and quadtiled data, it can be far more responsive than raster-based maps you may have seen in 2010. Plus, if you zoom all the way in in some views it has little person glyphs!
Author(s): Ben Schmidt
Publication Date: accessed 2 Dec 2022
Publication Site: Ben Schmidt’s personal site
Graphic:
Excerpt:
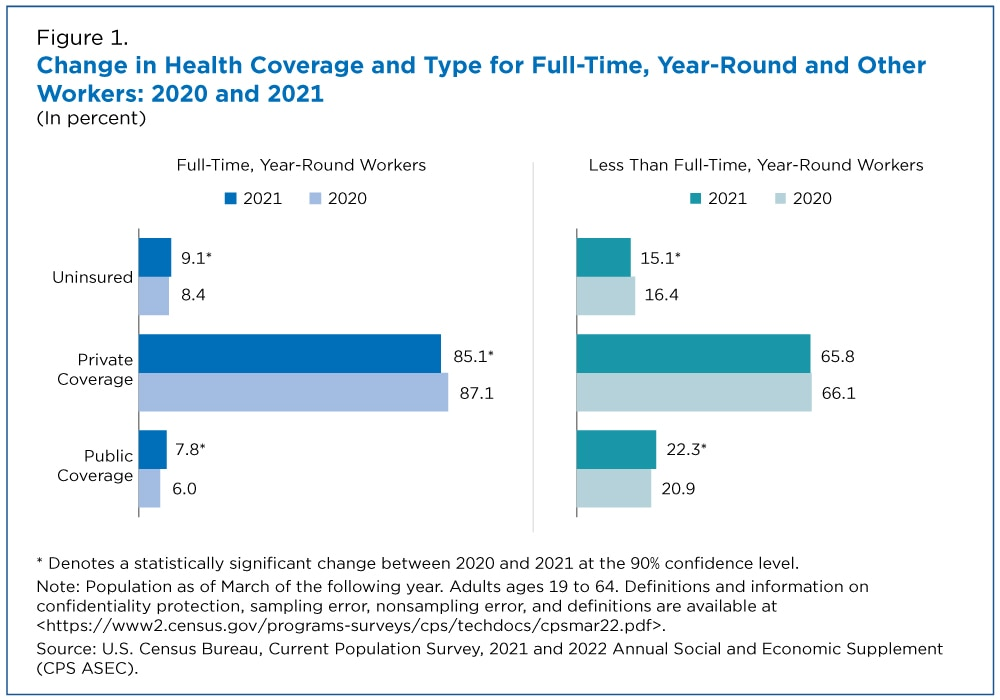
Between 2020 and 2021, there were changes in health insurance coverage rates for both full-time, year-round workers and those who worked less than full time, year-round.
The uninsured rate for full-time, year-round workers was 0.6 percentage points higher in 2021 than in 2020. Compared to 2020, a larger share of these workers had public coverage and a smaller share had private coverage, such as employer-based coverage.
Those who worked less than full time, year-round were 1.2 percentage points less likely to be uninsured in 2021 — not because more had private coverage but because a larger share had public health insurance.
Author(s): Katherine Keisler-Starkey, Laryssa Mykyta and Lisa Bunch
Publication Date: 13 Sept 2022
Publication Site: Census Bureau
Link: https://www.visualcapitalist.com/mapping-a-decade-of-us-population-growth/
Graphic:
Excerpt:
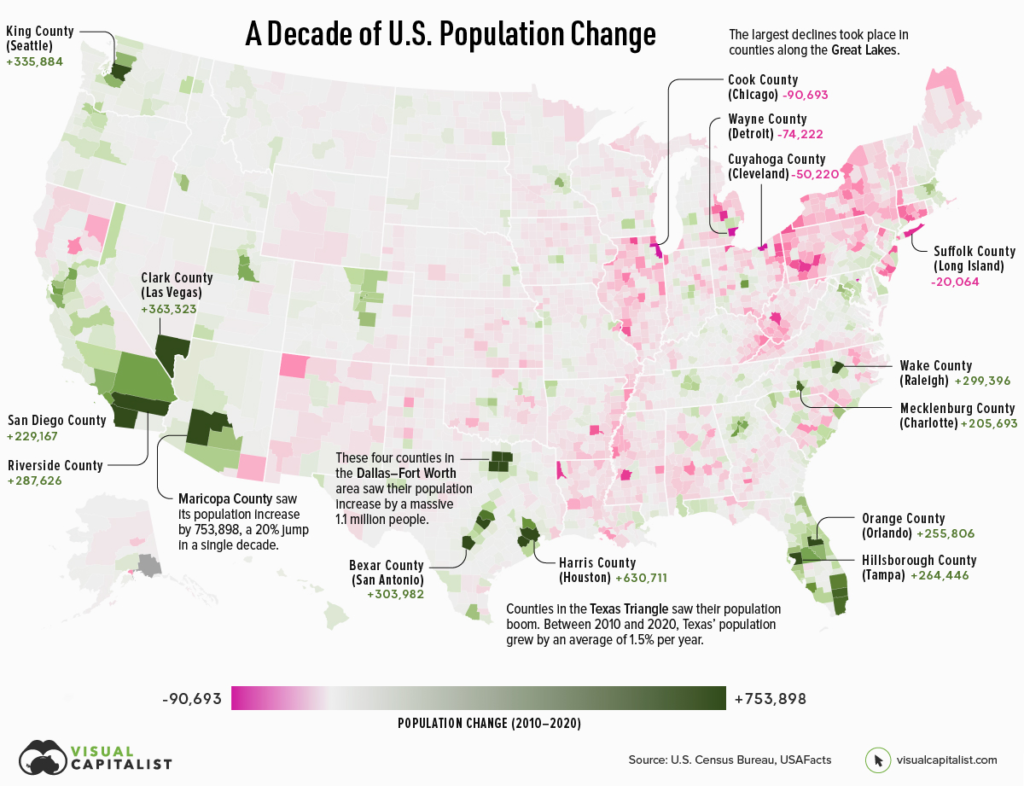
If an area sees a high number of migrants, along with a strong birth rate and low death rate, then its population is bound to increase over time. On the flip side, if more people are leaving the area than coming in, and the region’s birth rate is low, then its population will likely decline.
Which areas in the United States are seeing the most growth, and which places are seeing their populations dwindle?
This map, using data from the U.S. Census Bureau, shows a decade of population movement across U.S. counties, painting a detailed picture of U.S. population growth between 2010 and 2020.
Author(s): Nick Routley
Article/Editing: Carmen Ang
Publication Date: 16 Jun 2022
Publication Site: Visual Capitalist
Graphic:
Excerpt:
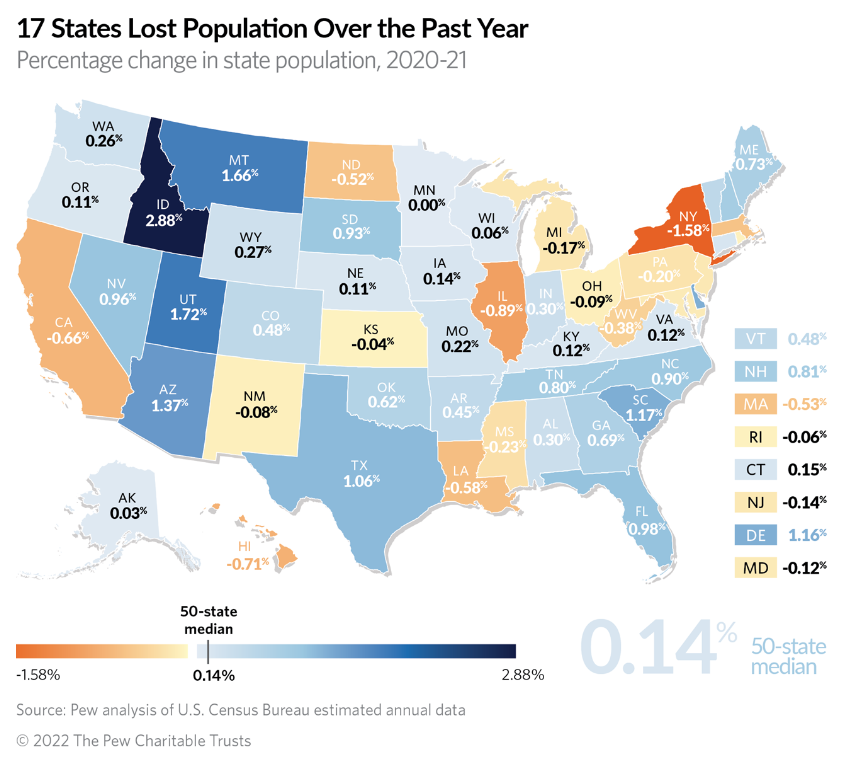
Among the 17 states where population declined over the year, losses were greatest in New York (-1.58%), Illinois (-0.89%), Hawaii (-0.71%) and California (-0.66%). Losses in these states were driven by people moving away.
Four states experienced population declines because more people moved out than in, and more people died than were born: Massachusetts, Mississippi, Michigan, and New Mexico. The data does not separate deaths related to COVID-19 from others.
Aside from states with declines, population grew slower over the year than over the 2010-20 period in 19 states. Among them, Washington, Colorado, and Oregon experienced the biggest slowdown in growth compared with their decade-long pace.
After Idaho and Utah, population grew the fastest in Montana (1.66%), Arizona (1.37%), South Carolina (1.17%), Delaware (1.16%), and Texas (1.06%). Gains in each came mostly from new residents moving into the state.
Fourteen states grew more quickly than their 10-year paces. Idaho, Montana, Maine and New Hampshire sped up the most.
Nationwide, gains from international migration exceeded gains from the natural increase in 2021. It was the first time that newcomers from other countries contributed more to population growth than gains from births in a given year, according to the U.S. Census Bureau.
Author(s): Joanna Biernacka-Lievestro & Alexandre Fall
Publication Date: 12 May 2022
Publication Site: Pew
Graphic:
Excerpt:
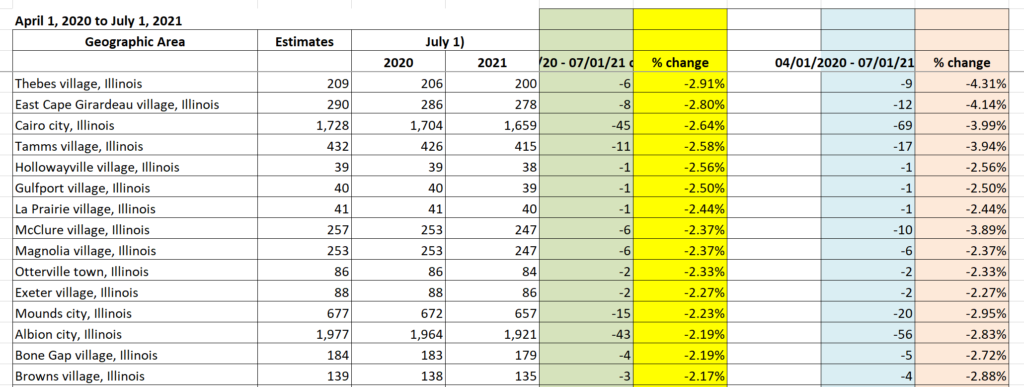
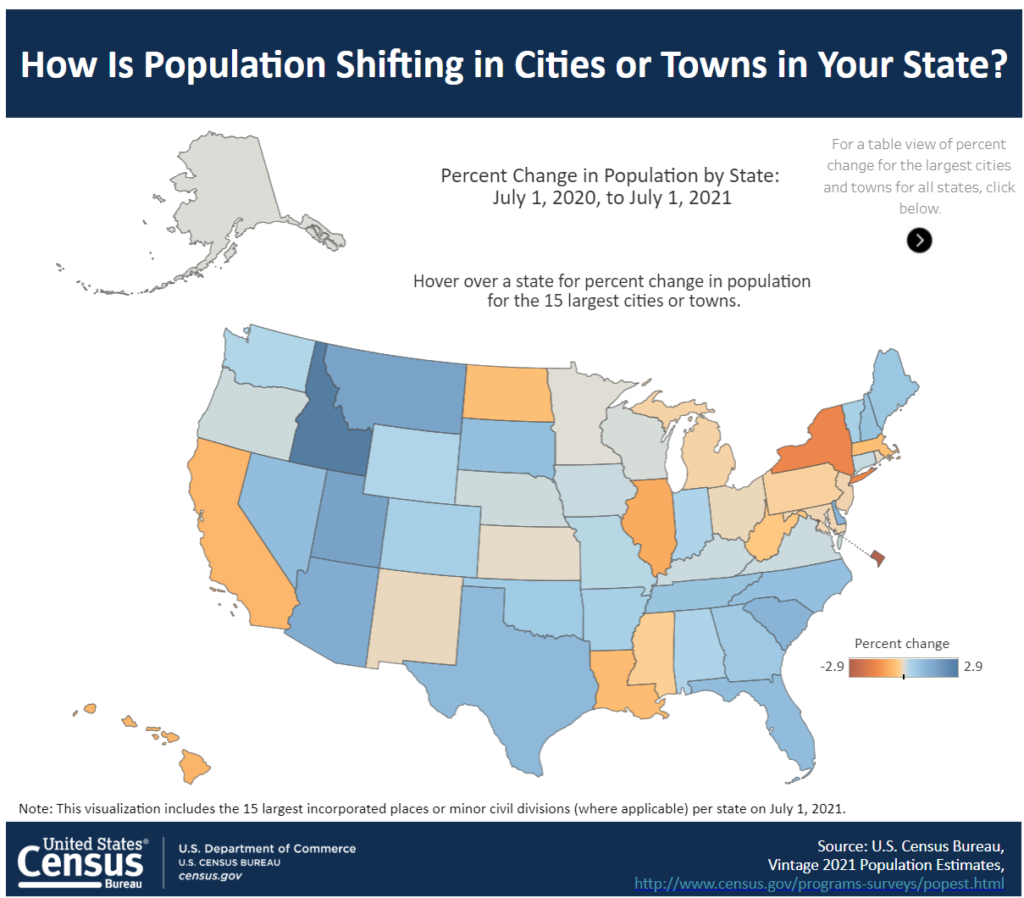
Cities and towns in Illinois lost more than 104,000 people in the 12 months up to July 1, 2021, according to new U.S. Census data released Thursday. Nearly half of Illinois’ losses were from Chicago.
The report for the entire country shows populations continue to shift to towns in the South and West regions of the United States.
“Arizona, Texas, Florida and Idaho all had several places among the 15 fastest-growing cities or towns,” the report said.
Of the 15 largest cities, New York lost nearly 305,500 people. Chicago lost 45,175 people, which was larger than Los Angeles’ loss of 40,537 people. Chicago is the third most populous city behind New York and L.A..
Author(s): Greg Bishop
Publication Date: 26 May 2022
Publication Site: The Center Square
Graphic:
Additional links:
Related Information
Population and Housing Unit Estimates
Produces estimates of the population for the United States, its states, counties, cities, and towns, as well as for the Commonwealth of Puerto Rico.
Our population statistics cover age, sex, race, Hispanic origin, migration, ancestry, language use, veterans, as well as population estimates and projections.
Publication Date: 26 May 2022
Publication Site: U.S. Census
PDF: https://www.census.gov/content/dam/Census/library/publications/2022/demo/p70br-177.pdf
Graphic:
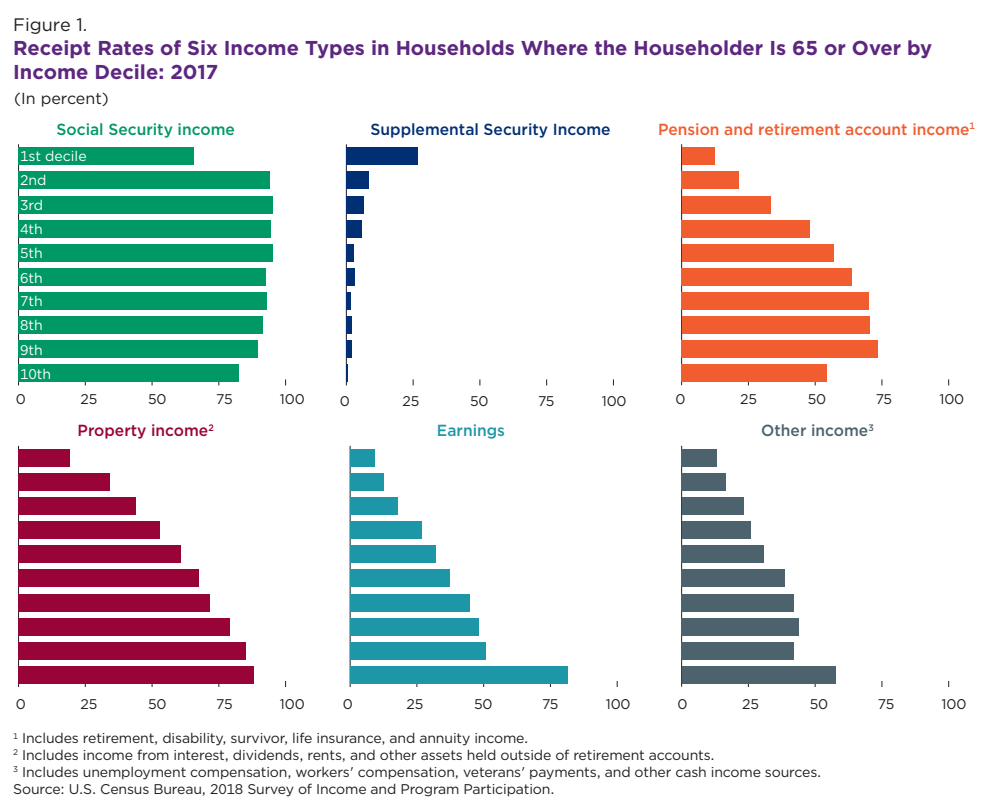
Excerpt:
This report examines older households’ sources of income, the amounts of this income, and how much each source of income contributes to total income. Older households receive income from a variety of sources, including social programs, private retirement savings, and earnings. Estimates from the 2018 Survey of Income and Program Participation (SIPP) show that in 2017, lower-income households relied on Social Security to a large degree, while higher-income households received a larger share of their income from private retirement savings and earnings.
Author(s): DANIEL THOMPSON AND MICHAEL D. KING
Publication Date: Feb 2022
Publication Site: U.S. Census
Link:https://www.census.gov/library/stories/2022/01/gender-pay-gap-widens-as-women-age.html
Graphic:
Excerpt:
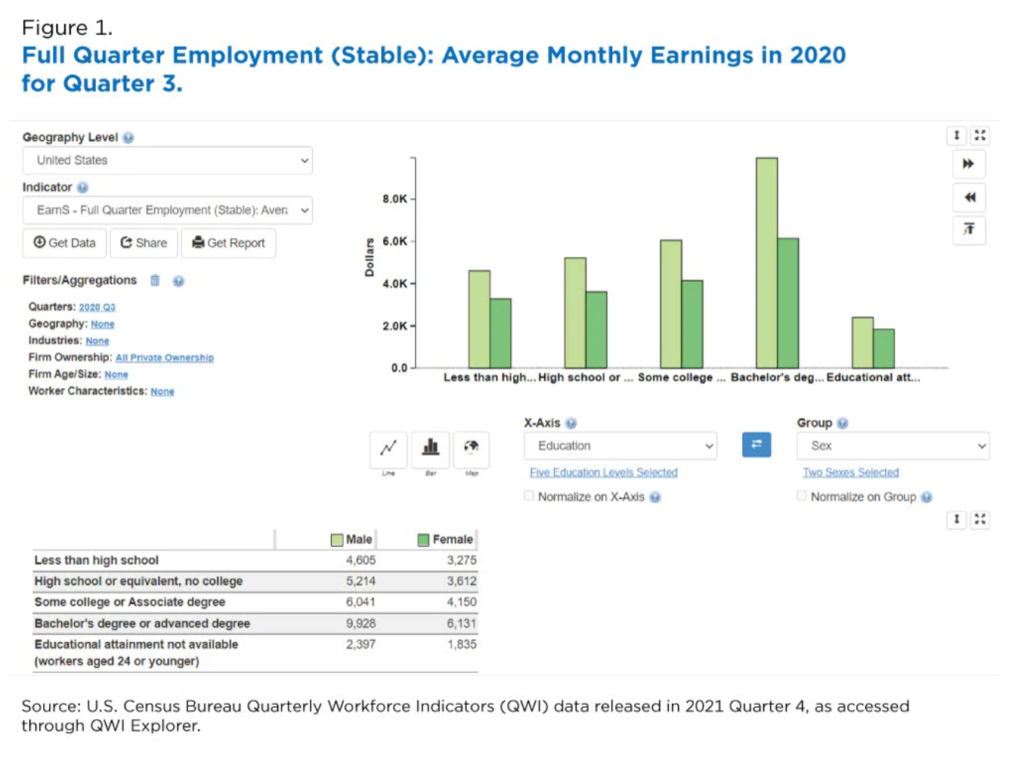
Women are over-represented in lower paying jobs and, as they age, the pay gap widens even more.
The U.S. Census Bureau’s Quarterly Workforce Indicators (QWI) shows the pay and age dynamic of women and men. Here, we looked at workers ages 35-44.
According to the QWI data based on unemployment insurance wage records for the third quarter of 2020 (the most recent national data), women in the United States earned 30% less than men and that pay gap increased with age.
….
QWI Explorer provides easy access to national data on earnings of women and men. Figure 1 shows a gap in monthly wages of almost $4,000 for women compared to men with a bachelor’s or advanced degree.
Author(s):EARLENE K.P. DOWELL
Publication Date: 27 Jan 2022
Publication Site: U.S. Census Bureau
Link: https://www.wsj.com/articles/covid-19-endemic-or-not-will-still-make-us-poorer-11642608213
Excerpt:
Endemic Covid-19 could thus become a lasting “supply shock” that degrades how much economies can produce, similar to the surge in oil prices in the 1970s. In October, the International Monetary Fund estimated global output this year would still be 3% lower than it had projected in 2019, with Western Europe and Latin America showing much bigger hits than China and Japan, where Covid-19’s toll has been much lower.
The U.S. is an exception: Output in the last quarter of 2021 was roughly back to its pre-pandemic trend. But the economy, distorted and disrupted by Covid-19, is struggling to sustain this level of output, as the surge in inflation to 7% demonstrates.
Covid-19 might have boosted efficiency in some industries by speeding up digitization and adoption of remote work. Goldman Sachs economists estimate this delivered a 3% to 4% boost to U.S. productivity.
But some of the shift to remote operations is involuntary, and some of the rise in productivity might reflect an overworked workforce. Indeed, the pandemic has left the labor force smaller, sicker and less happy. Absences due to illness among employed workers have averaged 50% higher in the last two years. In early January, nearly 12 million people weren’t working because they were sick with Covid-19, caring for someone with coronavirus, or concerned about getting or spreading the disease, according to a regular Census Bureau survey. The figure hasn’t been below 4 million since June 2020.
In the past year, workers have reported declining satisfaction with their wages and a rising “reservation wage,” that is, how much they would have to be paid to accept a new job, according to the Federal Reserve Bank of New York. This might reflect inflation, changed expectations, or stress due to Covid-19 testing, masks and vaccine mandates, or their absence.
For employers, this makes it much harder to attract the necessary staff. Nursing homes have boosted hourly wages 14% since the start of the pandemic, yet staffing has plummeted 12%, impairing their ability to accept new patients. Such shortages impose a cost that doesn’t show up in gross domestic product.
Author(s): Greg Ip
Publication Date: 19 Jan 2022
Publication Site: WSJ
Link: https://taxfoundation.org/state-population-change-2021/
Graphic:
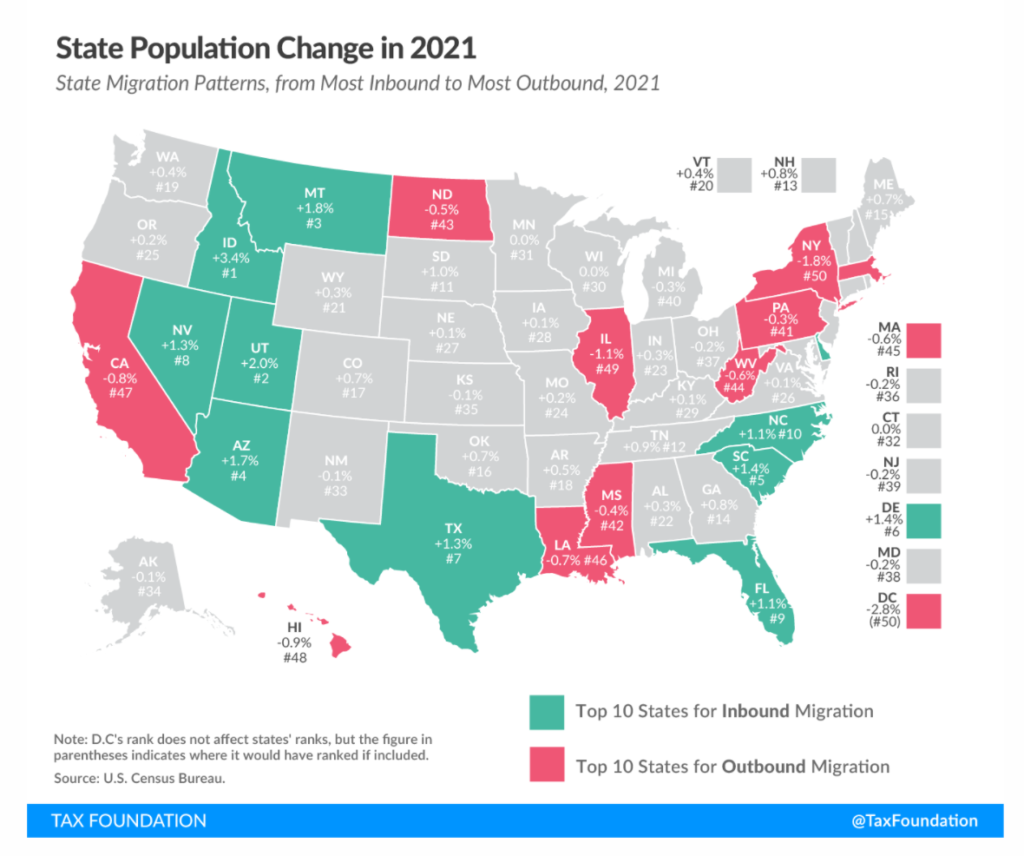
Excerpt:
Nationally, the U.S. population only grew by 0.1 percent between July 2020 and July 2021, the lowest rate since the nation’s founding. Pandemic-induced excess deaths, virtually nonexistent international in-migration, and an already-declining birth rate yielded an almost flat population trend nationwide. This, however, belies state-level and regional differences. Whereas the District of Columbia’s population shrunk by 2.8 percent between April 2020 (roughly the start of the pandemic) to July 2021, New York lost 1.8 percent of its population, and Illinois, Hawaii, and California rounded out the top five jurisdictions for population loss, Idaho was gaining 3.4 percent, while Utah, Montana, Arizona, South Carolina, Delaware, Texas, Nevada, Florida, and North Carolina all saw population gains of 1 percent or more.
The picture painted by this population shift is a clear one of people leaving high-tax, high-cost states for lower-tax, lower-cost alternatives. The individual income tax is only one component of overall tax burdens, but it is often highly salient, and is illustrative here. If we include the District of Columbia, then in the top one-third of states for population growth since the start of the pandemic (April 2020 to July 2021 data), the average combined top marginal state and local income tax rate is 3.5 percent, while in the bottom third of states, it is about 7.3 percent.
Author(s): Jared Walczak
Publication Date: 4 Jan 2022
Publication Site: Tax Foundation