St. Francis Dam Disaster – Frank Black and the Catholics

Description:

It’s not just a song, it’s a history lesson!

St. Francis Dam Disaster by Frank Black and the Catholics off of the album Dog in the Sand (2001 Cooking Vinyl)

Many of the pictures were culled from https://scvhistory.com/scvhistory/stfrancis.htm

They have a lot of info on the St. Francis Dam disaster and it’s worth checking out if you want to see more.

Image:

Author(s): Skippy .Bob

Publication Date: 1 December 2013

Publication Site: YouTube

Net Interest: Lemonade

Link: https://www.netinterest.co/p/my-adventures-in-cryptoland

Excerpt:

Insurance is a peculiar business because customers don’t really want it, hence the adage, “insurance is sold, not bought.” As much as she’s a customer, she’s also a counterparty: what’s good for her (a claim) is not good for the company. There’s a zero-sum dynamic to the relationship, which means that the classic Amazon flywheel around customer experience and lower pricing doesn’t work. 

This concept got Lemonade tied up in knots this week. In a series of tweets, the company told of how its platform is getting better at “delighting customers”. One way it does this is, “when a user files a claim, they record a video on their phone and explain what happened. Our AI carefully analyses these videos for signs of fraud. It can pick up non-verbal cues that traditional insurers can’t, since they don’t use a digital claims process.”

It seems a strange way to “delight” customers by allowing AI to auto-reject their claims based on how their face looks or their accent sounds. The company realized its (PR) error, deleted the tweets and issued a denial. But this is what happens when your customers and your shareholders start mixing in an industry that doesn’t lend itself very well to that.

Author(s): Marc Rubinstein

Publication Date: 28 May 2021

Publication Site: Net Interest at substack

The Decline in U.S. Fertility

Graphic:

Excerpt:

In the United States and other developed countries, fertility tends to drop during periods of economic decline. U.S. fertility rates fell to low levels during the Great Depression (1930s), around the time of the 1970s “oil shock,” and since the onset of the recent recession in 2007 (see Figure 1). The U.S. total fertility rate (TFR) stood at 2.0 births per woman in 2009, but preliminary data from the National Center for Health Statistics show that the TFR dropped to 1.9 in 2010—well below the replacement level of 2.1.1 A similar decline—or leveling off—of fertility rates has been reported in Ireland, Italy, Spain, Sweden, and several other European countries.

Author(s): Mark Mather

Publication Date: 18 July 2012

Publication Site: PRB

Will births in the US rebound? Probably not.

Graphic:

Excerpt:

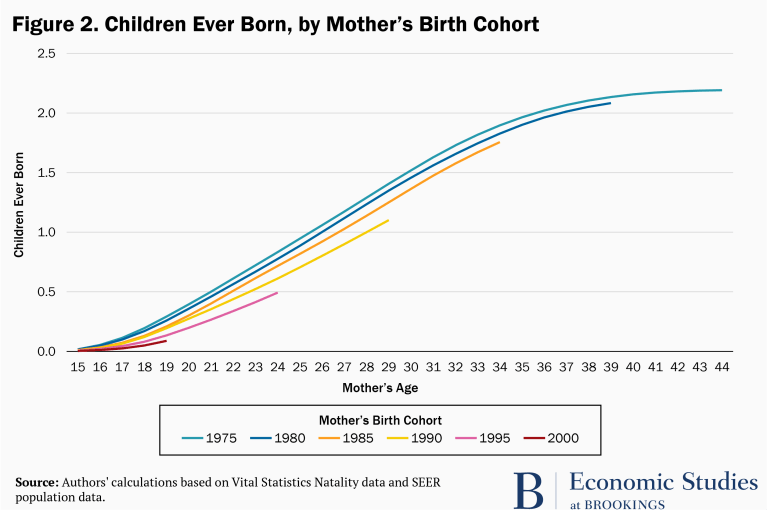
Figure 2 translates these childbearing age profiles into total number of children ever born by a certain age. The figure clearly shows that successively younger cohorts of women are having fewer children by specific ages. For instance, by age 24, the 1995 birth cohort of women had 38 percent fewer children than the 1975 and 1980 birth cohorts had at that age (0.5 compared to 0.8). This younger cohort would need to have 21 percent more children at each age from 25 through 44 to “catch up” to the earlier cohorts in terms of total lifetime childbearing. As another example, the 1990 birth cohort has had 21 percent fewer births through age 29 compared to the 1975 and 1980 cohorts; they would need to have 38 percent more births in their remaining childbearing years to catch up in terms of lifetime fertility.

Author(s): Melissa S. Kearney, Phillip Levine

Publication Date: 24 May 2021

Publication Site: Brookings

Not With a Bang, But a Whimper: Demographic Decline Undermines Public Finance

Link: https://marypatcampbell.substack.com/p/not-with-a-bang-but-a-whimper-demographic

Graphic:

Excerpt:

The last time the Census Bureau did a population projection, the estimated population for even 2020 came in a little high. From March 2018: Demographic Turning Points for the United States: Population Projections for 2020 to 2060 — they estimated a total population of about 332.6 million, and the apportionment Census results were 331.1 million. To be sure, this is a less than 0.5% difference, so no big deal.

This is the growth rate they projected, even in 2018:
2020-2030: 7%
2030-2040: 5%
2040-2050: 4%
2050-2060: 4%

Those are full-decade growth rates. That’s before the pandemic has shaved our numbers down a little.

Would you like to know the growth rates from prior decades?
2010-2020: 7%
2000-2010: 10%
1990-2000: 13%
1980-1990: 10%

Author(s): Mary Pat Campbell

Publication Date: 28 May 2021

Publication Site: STUMP at substack

Letter: Why should taxpayers bear CalPERS risk?

Excerpt:

The city [Chico] has been receiving more sales tax, property tax, developer fees, and Utility Tax revenues every year as development brings more people to Chico. Instead of maintaining and improving infrastructure, Staff has poured these funds into their pension deficit, $11,500,000 this year, by 2025, $13,000,000. This money is allocated from all the department funds, at the expense of infrastructure and services.

Instead of pursuing new taxes that will hurt our local economy, council needs to switch from CalPERS’ defined benefit plan to a defined contribution plan, like 401Ks. Why should the taxpayers but never the employees bear the burden of the risks taken by CalPERS? The POB scheme, which Dowell admits is “gambling,” puts ALL the burden on the taxpayers, forever. Any new revenues will go to the pension obligation first.

Author(s): Juanita Sumner, Chico

Publication Date: 26 May 2021

Publication Site: Oroville Mercury-Register

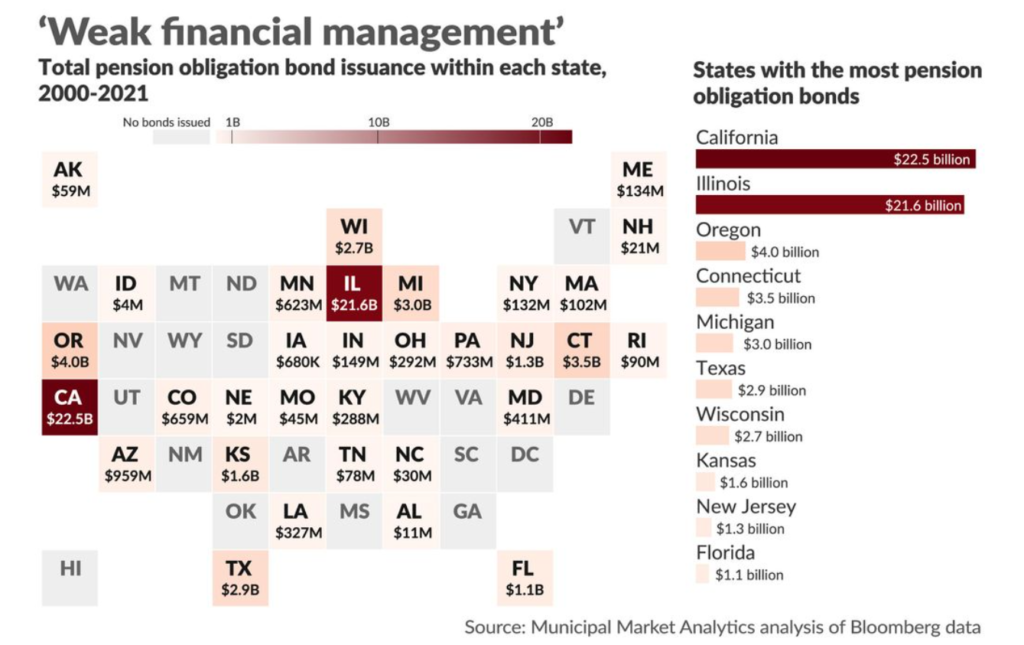
American cities and states have issued $72 billion of pension bonds. Here’s what that means

Link: https://www.marketwatch.com/story/american-cities-and-states-have-issued-72-billion-of-pension-bonds-heres-what-that-means-11621971315

Graphic:

Excerpt:

In his 2022 budget address, Milwaukee Mayor Tom Barrett wrote of his city’s predicament, “We are facing an unsustainable demand driven primarily by the pensions for public safety employees. We must begin preparing now, setting aside money to blunt the impact of the massive payments coming due in just two years.”

For many local governments, making a big deposit all at once and being able to budget for more manageable payments in the future, for both debt service and annual pension payments, can feel like a relief.

But there are many reasons it’s a bad idea, and one that many municipal-finance observers find problematic.

Author(s): Andrea Riguer, Katie Marriner

Publication Date: 26 May 2021

Publication Site: MarketWatch

Hard Lessons From the Coming Public Pension Plan Shortfall

Link: https://www.thestreet.com/investing/hard-lessons-from-the-coming-public-pension-plan-shortfall

Excerpt:

I predict that state and local government balance sheets, already reeling from the pandemic, will be devastated in coming years by the stock and bond markets’ disappointing returns.

That’s because these governments’ pension plans are based on unrealistic assumptions about how those markets will perform in the future, and are therefore woefully underfunded. In fact, even with their optimistic assumptions, those funds are already underfunded. Their “actuarial funded ratio” (the ratio of the actuarial value of their assets to the actuarial value of their liabilities) is just 71.5% currently.

These plans are hoping to make up their actuarial deficits by earning outsized investment returns. I’m willing to bet their earnings instead will fall far short of historical averages, and they will have to make up the shortfall either by raising taxes, cutting services, or declaring bankruptcy.

Author(s): Mark Hulbert

Publication Date: 25 May 2021

Publication Site: The Street

How Does Your State Treat Social Security Income?

Graphic:

Excerpt:

Thirteen states tax Social Security benefits, a matter of significant interest to retirees. Each of these states has its own approach to determining what share of benefits is subject to tax, though these provisions can be grouped together into a few broad categories. Today’s map illustrates these approaches.

Author(s): Janelle Cammenga

Publication Date: 26 May 2021

Publication Site: Tax Foundation

Baby boom to baby bust (CSM 1985)

Link: https://www.csmonitor.com/1985/1127/z1love3.html

Excerpt:

In the ’70s, these overpopulation alarms had widespread impact. A 1970 survey found that 69 percent of married women in America agreed that US overpopulation was a “serious problem” — and that many of them were lowering the number of children they intended to have.

Now, however, the birthrate in the industrial world is below the “replacement rate” of 2.1 children per woman. That rate is set at the number of children needed to replace every parent, with more added to account for mortality.

In 1855, white American women averaged 5.31 births — well above the then-current replacement rate of 3.32 (higher then because of higher infant mortality). By 1980, the figure had dropped to 1.75 children each — well below the 2.1 replacement rate. Even the high birthrate of US Hispanics — 56 percent more than non-Hispanics in 1982 — doesn’t raise the total US rate above replacement levels.

Author(s): Rushworth M. Kidder

Publication Date: 27 November 1985

Publication Site: Christian Science Monitor

Gun-related deaths

Graphic:

Excerpt:

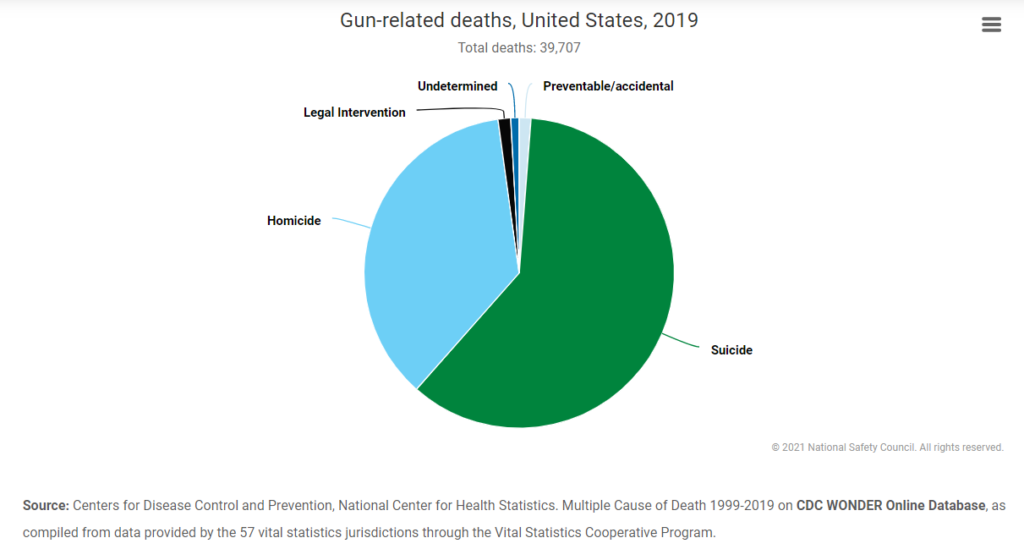
Gun-related deaths from preventable, intentional, and undetermined causes totaled 39,707 in 2019, nearly flat from 39,740 deaths in 2018. Suicides account for 60% of deaths related to firearms, while 36% were homicides, and about 1% were preventable/accidental. Please note that the term gun is used on this page to refer to firearms that can be carried by a person, not to the larger class of weapon.

Since 2014, gun-related assault deaths have increased 31%, but the most recent data show that the upward trend may be over, with less than a 1% increase in 2017, a 4% decrease in 2018, and a partial rebound with a 3% increase in 2019. Suicide deaths involving guns decreased 2.0%, marking the first decrease after 12 consecutive yearly increases.

Date Accessed: 26 May 2021

Publication Site: Injury Facts

What the data says about gun deaths in the U.S.

Graphic:

Excerpt:

Though they tend to get less attention than gun-related murders, suicides have long accounted for the majority of U.S. gun deaths. In 2017, six-in-ten gun-related deaths in the U.S. were suicides (23,854), while 37% were murders (14,542), according to the CDC. The remainder were unintentional (486), involved law enforcement (553) or had undetermined circumstances (338).

Author(s): JOHN GRAMLICH

Publication Date: 16 August 2019

Publication Site: Pew