DEFINING DISCRIMINATION IN INSURANCE

Link: https://www.casact.org/sites/default/files/2022-03/Research-Paper_Defining_Discrimination_In_Insurance.pdf?utm_source=III&utm_medium=Issue+Brief&utm_campaign=RIP+Series

Graphic:

Excerpt:

This research paper is designed to introduce various terms used in defining
discrimination by stakeholders in the insurance industry (regulators, consumer
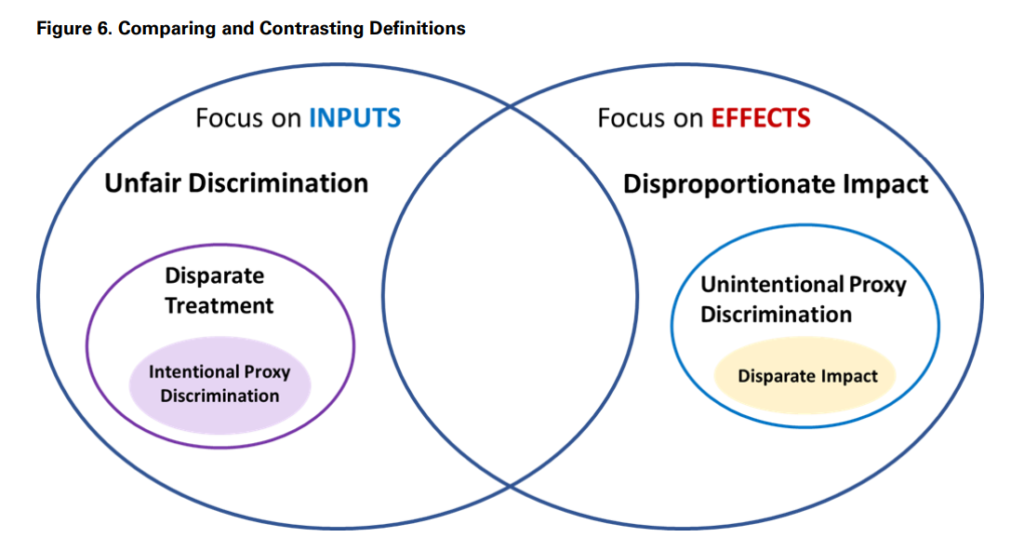
advocacy groups, actuaries and insurers, etc.). The paper defines protected class,
unfair discrimination, proxy discrimination, disproportionate impact, disparate
treatment and disparate impact.
Stakeholders are not always consistent in their definitions of these terms, and
these inconsistencies are highlighted and illustrated in this paper. It is essential to
elucidate key elements and attributes of certain terms as well as conflicting
approaches to defining discrimination in insurance in order to move the industry
discussion forward.
While this paper does not make a judgment on the appropriateness of the
definitions put forth, nor does it promulgate what the definitions should be,
readers will be empowered to understand the components of discrimination terms
used in insurance, as well as be introduced to the potential implications for
insurers.
Actuaries who have a strong foundational knowledge of these terms are likely to
play a key role in informing those who define and refine these terms for insurance
purposes in the future. This paper is not a legal review, and thus discusses terms
and concepts as they are used by insurance stakeholders, rather than what their
ultimate legal definition will be. However, it is important for actuaries to
understand the point of view of various stakeholders, and the potential impact it
could have on actuarial work. As the regulatory and legislative landscape
continues to shift, this brief should be considered a living document, that will
periodically require update.

Author(s): Kudakwashe F. Chibanda, FCAS

Publication Date: March 2022

Publication Site: CAS

Actuarial Group Takes Steps to Identify Racial Bias in Insurance Rates

Link: https://www.investopedia.com/race-and-insurance-5224764

Excerpt:

Two new papers from property casualty actuaries delve into issues of historical and ongoing bias in insurance pricing.

These papers are on potential Influences among four rating factors and attempts to actually define discrimination in insurance.

Factors such as geography, credit scoring, home ownership, and motor vehicle records affect homeowners and auto insurance rates and can cause Black consumers to pay higher premiums.

Actuaries and regulators are trying to untangle factors from societal prejudice for fairer pricing

AI or machine learning can augment or amplify these biases with their vast inputs, and data scientists will be analyzing outcomes for discriminatory pricing effects.

States have been taking action through regulation or pending legislation to extinguish some factors that can lead to racial bias or to examine data modeling to check for discriminatory effects.

Author(s): ELIZABETH FESTA

Publication Date: 5 April 2022

Publication Site: Investopedia

METHODS FOR QUANTIFYING DISCRIMINATORY EFFECTS ON PROTECTED CLASSES IN INSURANCE

Link: https://www.casact.org/sites/default/files/2022-03/Research-Paper_Methods-for-Quantifying-Discriminatory-Effects.pdf

Graphic:

Excerpt:

This research paper’s main objective is to inspire and generate discussions
about algorithmic bias across all areas of insurance and to encourage
actuaries to be involved. Evaluating financial risk involves the creation of
functions that consider myriad characteristics of the insured. Companies utilize
diverse statistical methods and techniques, from relatively simple regression
to complex and opaque machine learning algorithms. It has been alleged that
the predictions produced by these mathematical algorithms have
discriminatory effects against certain groups of society, known as protected
classes.
The notion of discriminatory effects describes the disproportionately adverse
effect algorithms and models could have on protected groups in society. As a
result of the potential for discriminatory effects, the analytical processes
followed by financial institutions for decision making have come under greater
scrutiny by legislators, regulators, and consumer advocates. Interested parties
want to know how to quantify such effects and potentially how to repair such
systems if discriminatory effects have been detected.


This paper provides:


• A historical perspective of unfair discrimination in society and its impact
on property and casualty insurance.
• Specific examples of allegations of bias in insurance and how the various
stakeholders, including regulators, legislators, consumer groups and
insurance companies have reacted and responded to these allegations.
• Some specific definitions of unfair discrimination and that are interpreted
in the context of insurance predictive models.
• A high-level description of some of the more common statistical metrics
for bias detection that have been recently developed by the machine
learning community, as well as a brief account of some machine learning
algorithms that can help with mitigating bias in models.


This paper also presents a concrete example of an insurance pricing GLM
model developed on anonymized French private passenger automobile data,
which demonstrates how discriminatory effects can be measured and
mitigated.

Author(s): Roosevelt Mosley, FCAS, and Radost Wenman, FCAS

Publication Date: March 2022

Publication Site: CAS

What is the value of the p-value?

Link: https://www.lucymcgowan.com/talk/north_carolina_translational_and_clinical_sciences_institute/

Slides: https://docs.google.com/presentation/d/1W51xBJOG7C37vHLJuBR4WT6NCJXQN0Iah-NKk9VCLxg/edit#slide=id.g12240d9f43a_0_0

Graphic:

Abstract:

The debate over the value and interpretation of p-value has endured since the time of its inception nearly 100 years ago. The use and interpretation of p-values vary by a host of factors, especially by discipline. These differences have proven to be a barrier when developing and implementing boundary-crossing clinical and translational science. The purpose of this panel discussion is to discuss misconceptions, debates, and alternatives to the p-value.

Author(s): Lucy D’Agostino McGowan

Publication Date: 26 April 2022

Publication Site: LucymcGowan.com

Risk-Based Rating in Personal Lines Insurance

Link: https://www.youtube.com/watch?v=IPYSSZkP-Oo&ab_channel=RStreetInstitute

Video:

Description:

The insurance industry is unique in that the cost of its products—insurance policies—is unknown at the time of sale. Insurers calculate the price of their policies with “risk-based rating,” wherein risk factors known to be correlated with the probability of future loss are incorporated into premium calculations. One of these risk factors employed in the rating process for personal automobile and homeowner’s insurance is a credit-based insurance score.

Credit-based insurance scores draw on some elements of the insurance buyer’s credit history. Actuaries have found this score to be strongly correlated with the potential for an insurance claim. The use of credit-based insurance scores by insurers has generated controversy, as some consumer organizations claim incorporating such scores into rating models is inherently discriminatory. R Street’s webinar explores the facts and the history of this issue with two of the most knowledgeable experts on the topic.

Featuring:

[Moderator] Jerry Theodorou, Director, Finance, Insurance & Trade Program, R Street Institute
Roosevelt Mosley, Principal and Consulting Actuary, Pinnacle Actuarial Services
Mory Katz, Legacy Practice Leader, BMS Group

R Street Institute is a nonprofit, nonpartisan, public policy research organization. Our mission is to engage in policy research and outreach to promote free markets and limited, effective government.

We believe free markets work better than the alternatives. We also recognize that the legislative process calls for practical responses to current problems. To that end, our motto is “Free markets. Real solutions.”

We offer research and analysis that advance the goals of a more market-oriented society and an effective, efficient government, with the full realization that progress on the ground tends to be made one inch at a time. In other words, we look for free-market victories on the margin.

Learn more at https://www.rstreet.org/
Follow us on Twitter at @RSI

Author(s): Jerry Theodorou, Roosevelt Mosley, Mory Katz

Publication Date: 4 April 2022

Publication Site: R Street at YouTube

Deep Learning for Liability-Driven Investment

Link: https://www.soa.org/sections/investment/investment-newsletter/2022/february/rr-2022-02-shang/

Graphic:

Excerpt:

This article summarizes key points from the recently published research paper “Deep Learning for Liability-Driven Investment,” which was sponsored by the Committee on Finance Research of the Society of Actuaries. The paper applies reinforcement learning and deep learning techniques to liability-driven investment (LDI). The full paper is available at https://www.soa.org/globalassets/assets/files/resources/research-report/2021/liability-driven-investment.pdf.

LDI is a key investment approach adopted by insurance companies and defined benefit (DB) pension funds. However, the complex structure of the liability portfolio and the volatile nature of capital markets make strategic asset allocation very challenging. On one hand, the optimization of a dynamic asset allocation strategy is difficult to achieve with dynamic programming, whose assumption as to liability evolution is often too simplified. On the other hand, using a grid-searching approach to find the best asset allocation or path to such an allocation is too computationally intensive, even if one restricts the choices to just a few asset classes.

Artificial intelligence is a promising approach for addressing these challenges. Using deep learning models and reinforcement learning (RL) to construct a framework for learning the optimal dynamic strategic asset allocation plan for LDI, one can design a stochastic experimental framework of the economic system as shown in Figure 1. In this framework, the program can identify appropriate strategy candidates by testing varying asset allocation strategies over time.

Author(s): Kailan Shang

Publication Date: February 2022

Publication Site: Risks & Rewards, SOA

What Machine Learning Can Do for You

Link: https://www.soa.org/sections/investment/investment-newsletter/2022/february/rr-2022-02-romoff/

Excerpt:

Some ML algorithms (e.g., random forests) work very nicely with missing data. No data cleaning is required when using these algorithms. In addition to not breaking down amid missing data, these algorithms use the fact of “missingness” as a feature to predict with. This compensates for when the missing points are not randomly missing.

Or, rather than dodge the problem, although that might be the best approach, you can impute the missing values and work from there. Here, very simple ML algorithms that look for the nearest data point (K-Nearest Neighbors) and infer its value work well. Simplicity here can be optimal because the modeling in data cleaning should not be mixed with the modeling in forecasting.

There are also remedies for missing data in time series. The challenge of time series data is that relationships exist, not just between variables, but between variables and their preceding states. And, from the point of view of a historical data point, relationships exist with the future states of the variables.

For the sake of predicting missing values, a data set can be augmented by including lagged values and negative-lagged values (i.e., future values). This, now-wider, augmented data set will have correlated predictors. The regularization trick can be used to forecast missing points with the available data. And, a strategy of repeatedly sampling, forecasting, and then averaging the forecasts can be used. Or, a similar turnkey approach is to use principal component analysis (PCA) following a similar strategy where a meta-algorithm will repeatedly impute, project, and refit until the imputed points stop changing. This is easier said than done, but it is doable.

Author(s): David Romoff

Publication Date: February 2022

Publication Site: Risks & Rewards, SOA

Underdispersion in the reported Covid-19 case and death numbers may suggest data manipulations

Link: https://www.medrxiv.org/content/10.1101/2022.02.11.22270841v1

doi: https://doi.org/10.1101/2022.02.11.22270841

Graphic:

Abstract:

We suggest a statistical test for underdispersion in the reported Covid-19 case and death numbers, compared to the variance expected under the Poisson distribution. Screening all countries in the World Health Organization (WHO) dataset for evidence of underdispersion yields 21 country with statistically significant underdispersion. Most of the countries in this list are known, based on the excess mortality data, to strongly undercount Covid deaths. We argue that Poisson underdispersion provides a simple and useful test to detect reporting anomalies and highlight unreliable data.

Author(s): Dmitry Kobak

Publication Date: 13 Feb 2022

Publication Site: medRXiV

Are some countries faking their covid-19 death counts?

Link: https://www.economist.com/graphic-detail/2022/02/25/are-some-countries-faking-their-covid-19-death-counts

Graphic:

Excerpt:

Irregular statistical variation has proven a powerful forensic tool for detecting possible fraud in academic research, accounting statements and election tallies. Now similar techniques are helping to find a new subgenre of faked numbers: covid-19 death tolls.

That is the conclusion of a new study to be published in Significance, a statistics magazine, by the researcher Dmitry Kobak. Mr Kobak has a penchant for such studies—he previously demonstrated fraud in Russian elections based on anomalous tallies from polling stations. His latest study examines how reported death tolls vary over time. He finds that this variance is suspiciously low in a clutch of countries—almost exclusively those without a functioning democracy or a free press.

Mr Kobak uses a test based on the “Poisson distribution”. This is named after a French statistician who first noticed that when modelling certain kinds of counts, such as the number of people who enter a railway station in an hour, the distribution takes on a specific shape with one mathematically pleasing property: the mean of the distribution is equal to its variance.

This idea can be useful in modelling the number of covid deaths, but requires one extension. Unlike a typical Poisson process, the number of people who die of covid can be correlated from one day to the next—superspreader events, for example, lead to spikes in deaths. As a result, the distribution of deaths should be what statisticians call “overdispersed”—the variance should be greater than the mean. Jonas Schöley, a demographer not involved with Mr Kobak’s research, says he has never in his career encountered death tallies that would fail this test.

….

The Russian numbers offer an example of abnormal neatness. In August 2021 daily death tallies went no lower than 746 and no higher than 799. Russia’s invariant numbers continued into the first week of September, ranging from 792 to 799. A back-of-the-envelope calculation shows that such a low-variation week would occur by chance once every 2,747 years.

Publication Date: 25 Feb 2022

Publication Site: The Economist

Getting Started with Julia for Actuaries

Link:https://www.soa.org/digital-publishing-platform/emerging-topics/getting-started-with-julia/

Graphic:

Excerpt:

Sensitivity testing is very common in actuarial workflows: essentially, it’s understanding the change in one variable in relation to another. In other words, the derivative!

Julia has unique capabilities where almost across the entire language and ecosystem, you can take the derivative of entire functions or scripts. For example, the following is real Julia code to automatically calculate the sensitivity of the ending account value with respect to the inputs:

When executing the code above, Julia isn’t just adding a small amount and calculating the finite difference. Differentiation is applied to entire programs through extensive use of basic derivatives and the chain rule. Automatic differentiation, has uses in optimization, machine learning, sensitivity testing, and risk analysis. You can read more about Julia’s autodiff ecosystem here.

Author(s): Alec Loudenback, FSA, MAAA; Dimitar Vanguelov

Publication Date: October 2021

Publication Site: SOA Digital, Emerging Topics

Actuarial Data Science Tutorials

Link: https://www.actuarialdatascience.org/ADS-Tutorials/

Graphic:

Excerpt:

On this page we present all the tutorials that have been prepared by the working party. We are intensively working on additional ones and we aim to have approx. 10 tutorials, covering a wide range of Data Science topics relevant for actuaries.

All tutorials consist of an article and the corresponding code. In the article, we describe the methodology and the statistical model. By providing you with the code you can easily replicate the analysis performed and test it on your own data.

Author(s): Swiss Association of Actuaries

Publication Date: accessed 20 Jan 2022

Publication Site: Actuarial Data Science

Which Data Fairly Differentiate? American Views on the Use of Personal Data in Two Market Settings

Link:https://sociologicalscience.com/articles-v8-2-26/

doi: 10.15195/v8.a2

Graphic:

Abstract:

Corporations increasingly use personal data to offer individuals different products and prices. I present first-of-its-kind evidence about how U.S. consumers assess the fairness of companies using personal information in this way. Drawing on a nationally representative survey that asks respondents to rate how fair or unfair it is for car insurers and lenders to use various sorts of information—from credit scores to web browser history to residential moves—I find that everyday Americans make strong moral distinctions among types of data, even when they are told data predict consumer behavior (insurance claims and loan defaults, respectively). Open-ended responses show that people adjudicate fairness by drawing on shared understandings of whether data are logically related to the predicted outcome and whether the categories companies use conflate morally distinct individuals. These findings demonstrate how dynamics long studied by economic sociologists manifest in legitimating a new and important mode of market allocation.

Author(s):Barbara Kiviat

Publication Date: 13 Jan 2021

Publication Site: Sociological Science