Embedded Bias: How Medical Records Sow Discrimination

Link: https://khn.org/news/article/electronic-medical-records-doctor-bias-open-notes-treatment-discrimination/

Excerpt:

Narrow or prejudiced thinking is simple to write down and easy to copy and paste over and over. Descriptions such as “difficult” and “disruptive” can become hard to escape. Once so labeled, patients can experience “downstream effects,” said Dr. Hardeep Singh, an expert in misdiagnosis who works at the Michael E. DeBakey Veterans Affairs Medical Center in Houston. He estimates misdiagnosis affects 12 million patients a year.

Conveying bias can be as simple as a pair of quotation marks. One team of researchers found that Black patients, in particular, were quoted in their records more frequently than other patients when physicians were characterizing their symptoms or health issues. The quotation mark patterns detected by researchers could be a sign of disrespect, used to communicate irony or sarcasm to future clinical readers. Among the types of phrases the researchers spotlighted were colloquial language or statements made in Black or ethnic slang.

“Black patients may be subject to systematic bias in physicians’ perceptions of their credibility,” the authors of the paper wrote.

That’s just one study in an incoming tide focused on the variations in the language that clinicians use to describe patients of different races and genders. In many ways, the research is just catching up to what patients and doctors knew already, that discrimination can be conveyed and furthered by partial accounts.

Author(s): Darius Tahir

Publication Date: 26 Sept 2022

Publication Site: Kaiser Health News
5 Worst States for Working-Age Deaths in August

Link: https://www.thinkadvisor.com/2022/09/27/5-worst-states-for-working-age-deaths-in-august/

Graphic:

Excerpt:

The number of deaths of working-age Americans was lower in August than in August 2021, but it was still much higher than it was in August 2019, before the COVID-19 pandemic began.

Death figures for the period from July 31 through Aug. 27 are just starting to firm up. But very early figures show that at least 53,655 U.S. residents ages 25 through 64 died from COVID-19 and all other causes during that four-week period.

The number of deaths was down sharply from 77,847 in August 2021, but it was still up 6.1% from the total of 50,590 for August 2019.

Author(s): Allison Bell

Publication Date: 27 Sept 2022

Publication Site: Think Advisor

Late-in-Life Decisions Guide

Link: https://www.soa.org/resources/research-reports/2022/2022-lil-decisions-guide/

report: https://www.soa.org/497f1c/globalassets/assets/files/resources/research-report/2022/lil-decisions-guide.pdf

Graphic:

Excerpt:

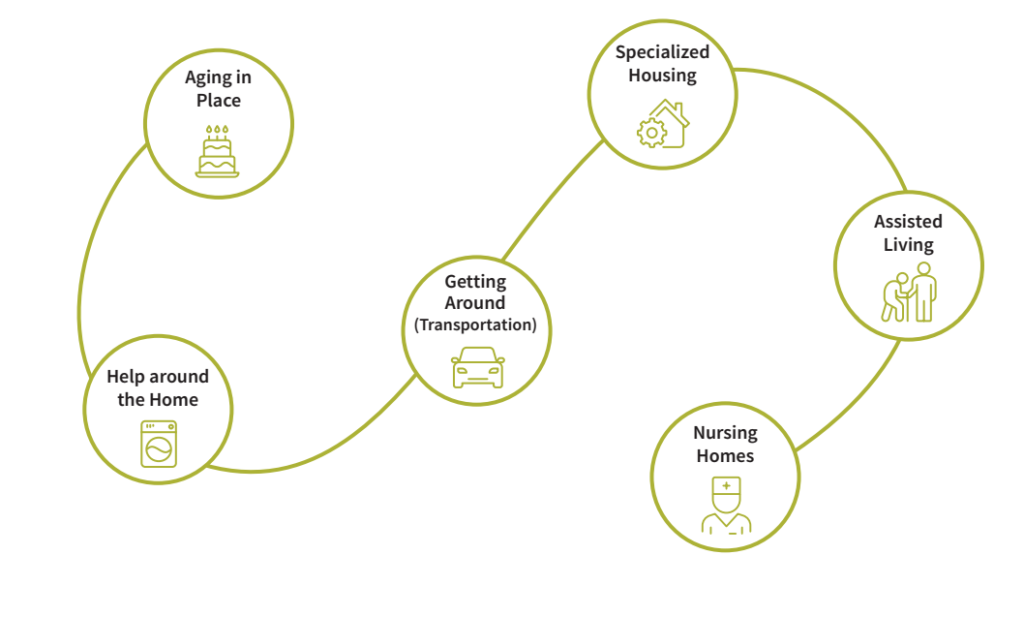
Much of retirement planning focuses on financial, investment, and estate planning needs. Earlier research,
such as the SOA’s Retirement Health & Happiness brief, showcases how this retirement planning overlooks some challenges of late-in-life retirees.


Retirees have access to more than 200,000 personal finance professionals, 10,000 senior centers, and
approximately 28,000 assisted living facilities. Still, do retirees have all the information they need to make
critical decisions throughout retirement, particularly in the latter stages of retirement?

In collaboration with Financial Finesse, the SOA Aging and Retirement Strategic Research Program
prepared this guide as a resource to help older retirees and those who assist them. This guide will
help the reader ask impactful questions to make informed decisions.

Author(s): SOA Aging and Retirement Strategic Research Program

Publication Date: 2022

Publication Site: Society of Actuaries

BIG DATA AND ALGORITHMS IN ACTUARIAL MODELING AND CONSUMER IMPACTS

Link: https://www.actuary.org/sites/default/files/2022-08/IABAAug2022_Sandberg_Presentation.pdf

Graphic:

Excerpt:

Systemic Influences and Socioeconomics
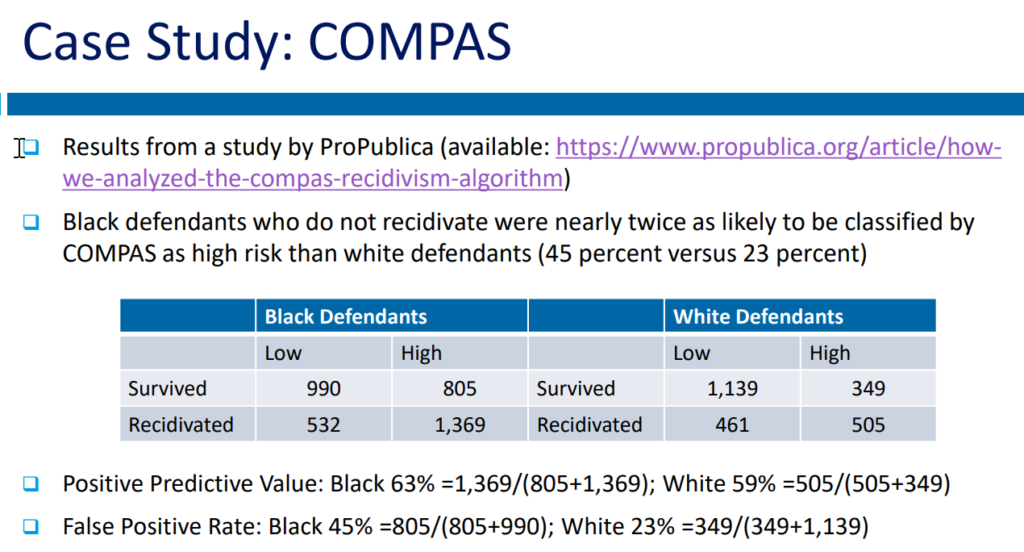
❑ Checking for and removing of systemic biases is difficult.
❑ Systemic biases can creep in at every step of the modeling process: data,
algorithms, and validation of results.
❑ Human involvement in designing and coding algorithms, where there is a lack of diversity
among coders
❑ Biases embedded in training datasets
❑ Use of variables that proxy for membership in a protected class
❑ Statistical discrimination profiling shopping behavior, such as price optimization
❑ Technology-facilitated advertising algorithms used in ad targeting and ad delivery

Author(s): David Sandberg, Data Science and Analytics Committee, AAA

Publication Date: August 2022

Publication Site: American Academy of Actuaries

Consumer Watchdog Calls on Insurance Commissioner Lara to Reject Allstate’s Job-Based Insurance Rate Discrimination, Adopt Regulations to Stop the Practice Industrywide

Link: https://www.prnewswire.com/news-releases/consumer-watchdog-calls-on-insurance-commissioner-lara-to-reject-allstates-job-based-insurance-rate-discrimination-adopt-regulations-to-stop-the-practice-industrywide-301631577.html

Additional: https://consumerwatchdog.org/sites/default/files/2022-09/2022-09-22%20Ltr%20to%20Commissioner%20re%20Allstate%20Auto%20Rate%20Application%20w%20Exhibits.pdf

Graphic:

Excerpt:

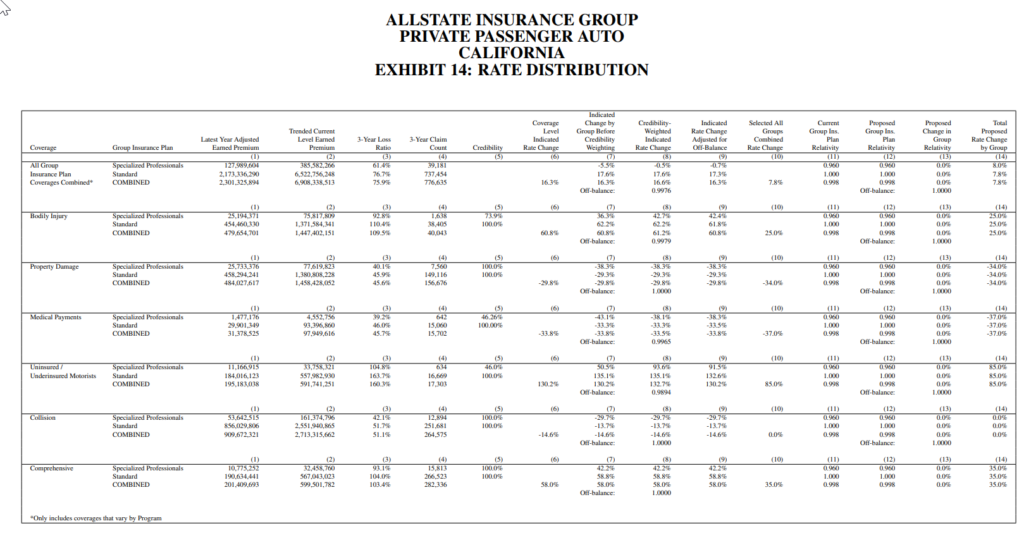
Insurance Commissioner Ricardo Lara should reject Allstate’s proposed $165 million auto insurance rate hike and its two-tiered job- and education-based discriminatory rating system, wrote Consumer Watchdog in a letter sent to the Commissioner today. The group called on the Commissioner to adopt regulations to require all insurance companies industrywide to rate Californians fairly, regardless of their job or education levels, as he promised to do nearly three years ago. Additionally, the group urged the Commissioner to notice a public hearing to determine the additional amounts Allstate owes its customers for premium overcharges during the COVID-19 pandemic, when most Californians were driving less.

Overall, the rate hike will impact over 900,000 Allstate policyholders, who face an average $167 annual premium increase.

Under Allstate’s proposed job-based rating plan, low-income workers such as custodians, construction workers, and grocery clerks will pay higher premiums than drivers in the company’s preferred “professional” occupations, including engineers with a college degree, who get an arbitrary 4% rate reduction.

Author(s): Consumer Watchdog

Publication Date: 22 Sept 2022

Publication Site: PRNewswire

Covid Still Kills, but the Demographics of Its Victims Are Shifting

Link: https://khn.org/news/article/covid-still-kills-but-the-demographics-of-its-victims-are-shifting/

Graphic:

Excerpt:

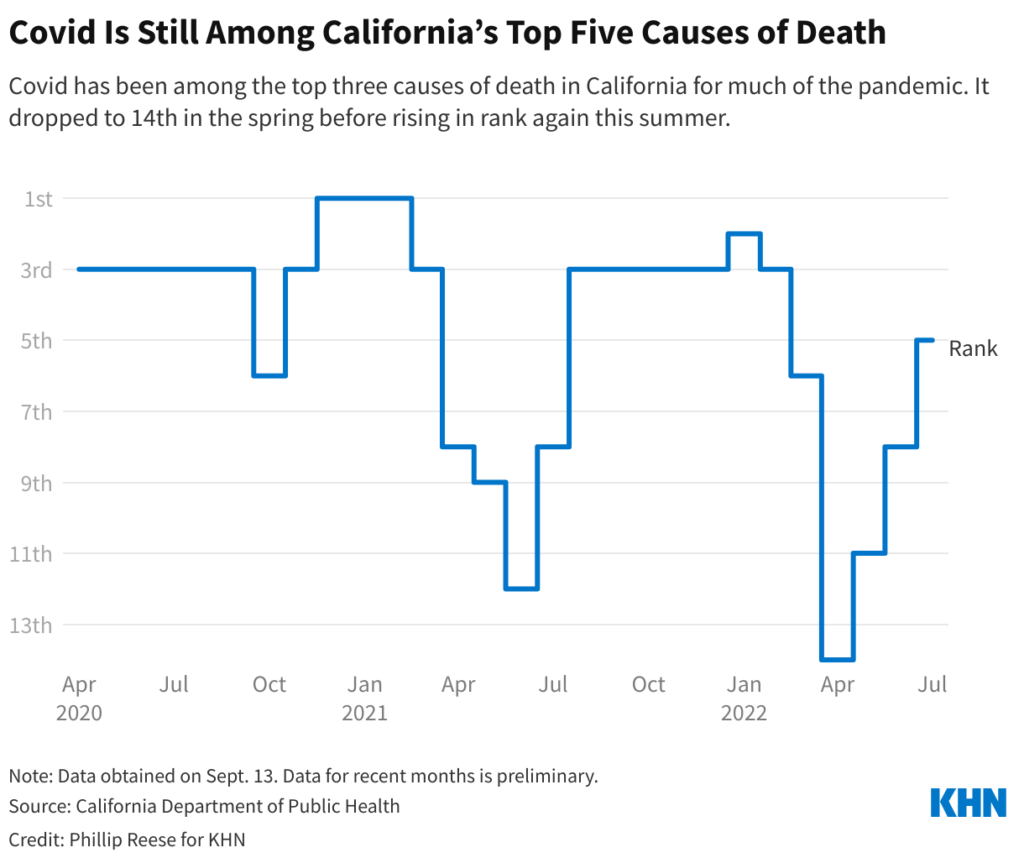
Californians age 75 and older made up 53% of covid deaths through July in 2022, up from 46% in 2020 and 2021. Only about 6% of the state’s residents are 75 and older. And white Californians 75 and older outnumber Latinos in that age group about 3 to 1.

In the initial vaccination rollout, California prioritized seniors, first responders, and other essential workers, and for several months in 2021 older residents were much more likely to be vaccinated than younger Californians.

“Now, the vaccination rates have caught up pretty much with everybody except for kids, people under 18,” Brewer said. “You’re seeing it go back to what we saw before, which is that age remains the most important risk factor for death.”

Author(s): Phillip Reese

Publication Date: SEPTEMBER 21, 2022

Publication Site: KFF

Social and Other Determinants of Life Insurance Demand

Link: https://www.soa.org/resources/research-reports/2022/determinants-life-insurance/

Report: https://www.soa.org/4a50aa/globalassets/assets/files/resources/research-report/2022/determinants-life-insurance.pdf

Graphic:

Excerpt:

The authors examine 19 factors to determine which were most closely linked to permanent and term life insurance premiums sold in the United States in 2020. With spatial regression analysis using multi-scale geographically weighted regression (MGWR) approach, the authors find the following 5 covariates to be the most statistically significant for and positively correlated with permanent insurance sold: household income, percentage of the population that is African American, education, health insurance, and Gini index (a statistical measure of wealth inequality). For term insurance sold, the 5 most significant covariates are household income, education, Gini index, percentage of households with no vehicles, and health insurance. Their relationships with term insurance sold are positive except for the percentage of households with no vehicles.

Author(s):

Wilmer Martinez
Kyran Cupido
Petar Jevtic
Jianxi Su

Publication Date: August 2022

Publication Site: SOA

Insurers Must Reach Millennials and Gen Zers. Here’s How

Link: https://www.thinkadvisor.com/2022/09/12/insurers-must-reach-millennials-and-gen-zers-heres-how/

Excerpt:

Based on the widely used Pew Research definitions, the millennials are turning 26 through 41 this year, and Gen Zers are turning 10 through 25.

More than half of Gen Zers ages 16 through 24 are already in the workforce.

It’s time for carriers to innovate rapidly to respond to the buying preferences of members of these generations.

…..

As an example, if the target customers are millennials and Gen Zers who need a simple term life insurance solution, you may want to focus on instant decision underwriting and lower face amounts to meet the most basic needs.

This approach could mean that many historical riders and features are actually not necessary.

It likely also means that the tools used in underwriting need to focus on information that is available instantly as opposed to traditional methods that could take weeks or even months.

Author(s): Jeremy Bill

Publication Date: 12 Sept 2022

Publication Site: Think Advisor

The Impacts of Covid-19 Illnesses on Workers

Link: https://siepr.stanford.edu/publications/working-paper/impacts-covid-19-illnesses-workers

Graphic:

Excerpt:

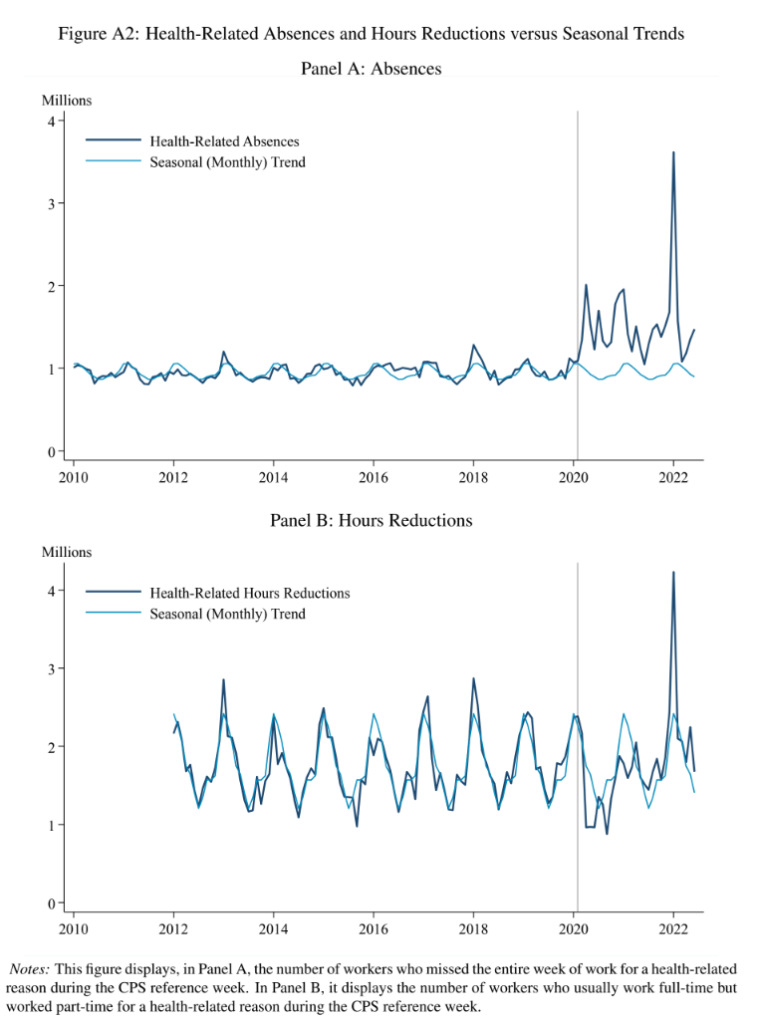
We show that Covid-19 illnesses persistently reduce labor supply. Using an event study, we estimate that workers with week-long Covid-19 work absences are 7 percentage points less likely to be in the labor force one year later compared to otherwise-similar workers who do not miss a week of work for health reasons. Our estimates suggest Covid-19 illnesses have reduced the U.S. labor force by approximately 500,000 people (0.2 percent of adults) and imply an average forgone earnings per Covid-19 absence of at least $9,000, about 90 percent of which reflects lost labor supply beyond the initial absence week.

Author(s):

Gopi Shah Goda
Evan J. Soltas

Publication Date: Sept 2022

Publication Site: Stanford University, Stanford Institute for Economic Policy Research (SIEPR)

Covid-19 Illnesses Are Keeping at Least 500,000 Workers Out of U.S. Labor Force, Study Says

Link: https://www.wsj.com/articles/covid-19-illnesses-are-keeping-at-least-500-000-workers-out-of-u-s-labor-force-study-says-11662955321

Excerpt:

Illness caused by Covid-19 shrank the U.S. labor force by around 500,000 people, a hit that is likely to persist if the virus continues to sicken workers at current rates, according to a new study released Monday.

Millions of people left the labor force — the number of people working or looking for work — during the pandemic for various reasons, including retirement, lack of child care and fear of Covid. The total size of the labor force reached 164.7 million people in August, exceeding the February 2020 prepandemic level for the first time. The labor force would have 500,000 more members if not for the people sickened by Covid, according to the study’s authors, economists Gopi Shah Goda of Stanford University and Evan J. Soltas at the Massachusetts Institute of Technology.

“If we stay where we are with Covid infection rates going forward, we expect that 500,000-person loss to persist until either exposure goes down or severity goes down,” said Mr. Soltas. That assumes that some of those previously sickened eventually return to work.

Author(s): Gwynn Guilford

Publication Date: 12 Sept 2022

Publication Site: WSJ

5 Worst States for Working-Age Death Increases in July

Link: https://www.thinkadvisor.com/2022/09/12/5-worst-states-for-working-age-death-increases-in-july/

Graphic:

Excerpt:

Early government mortality numbers show that the number of U.S. deaths has stayed very high this summer, both for members of the general population and for working-age people.

For all U.S. residents, for the period from July 3 through Aug. 27, the number of deaths recorded in the U.S. Centers for Disease Control and Prevention’s FluView reports was 426,881, according to the report released Friday, which included data sent to the CDC by Sept. 3.

The “all cause” total for the general population was down just 0.8% from the total for the comparable period in 2021, and it was 22% higher than the total for the comparable period in 2019, before the COVID-19 pandemic began.

For U.S. residents ages 25 through 64, the all-cause death total during that same period was 113,665, according to early, weighted data in the CDC’s Weekly Counts of Deaths by Jurisdiction and Age reports, as of Sept. 8.

Author(s): Allison Bell

Publication Date: 12 Sept 2022

Publication Site: Think Advisor

Two Key Takeaways From The New CDC Life Expectancy Data

Link: https://www.forbes.com/sites/ebauer/2022/09/02/two-key-takeaways-from-the-new-cdc-life-expectancy-data/?sh=6ce149f31cfc

Excerpt:

To what extent, are these drops of life expectancy due to Covid-19, rather than other causes?

From 2019 to 2020, the CDC reports that 90% of the drop in Hispanic life expectancy was attributable to Covid; the corresponding rates were 68% for whites and 59% for blacks. (No breakdown was provided for the AIAN or Asian categories.) However, the CDC data splits its breakdowns into “contributions to decreases” and “contributions to increases” rather than overall net effect. Those readers who are used to looking at data and charts will expect a “waterfall” style chart; the CDC version is not this, and is not particularly helpful.

In any event, relative to the 2020 baseline, the further decreases in life expectancy during 2021 had multiple causes. Only among the White demographic group was Covid the cause of over half of the decline; unintentional injury (including overdoses) was the second-largest contributing factor and for the AIAN demographic group, worsening rates of death due to chronic liver disease and cirrhosis played almost as substantial a role.

And, finally, it is important to understand that the CDC data shows a continued improvement in life expectancy due to reductions in death due to such causes as influenza/pneumonia, COPD/emphysema, Alzheimer disease, diabetes, and perinatal conditions (infant deaths). In fact, strikingly, in 2021, heart disease was a contributor to increased life expectancy in the Black, Hispanic, and Asian demographic groups, but a contributor to decreased life expectancy for the White and AIAN groups.

Again, though, the way the CDC provides its information means that, when it comes down to it, there is much that is simply missing; we do not know the magnitude of the improvements in life expectancy due to these causes, just that it exists. It even seems likely, or at least possible, that some of the apparent improvement in mortality due to these factors was actually because deaths were actually recorded as Covid deaths instead (whether due to multiple causes of death or other reasons).

Author(s): Elizabeth Bauer

Publication Date: 2 Sept 2022

Publication Site: Forbes