Excess mortality is expected to occur for all years studied with amounts varying by year and age. Although the largest mortality excess numbers for the U.S. general population are foreseen for 2022, excess mortality is expected to decline each year so that by 2030, excess mortality numbers are nearing expected levels. For 2030, mortality is projected to be 2% higher than expected for all ages except age 85. At this age, 2030 projected mortality is estimated to be 1% higher than expected.
Based on the average of the participants, generally, the amount of mortality excess is anticipated to be highest at the younger ages. For example, for 2022, projected mortality is anticipated to be 14% higher compared to expected levels for age 25, 13% higher for age 45, and 10% higher for ages 65 and 85.
In the book Aging in the Right Place from 2015, author Stephen Golant provides a number of reasons why that “right place” might be the longtime family home:
•The advantages of a familiar neighborhood: the individual knows the shops and services and can navigate the area well even after physical or cognitive decline.
•The advantages of a familiar home: spatial competence (finding your way when the power goes out, navigating steps out of familiarity)
•Preserving familiar relationships – friendships and service providers.
•The attachment to possessions and pets is not disrupted (e.g., vs. moving to no-pets home); the home not only contains memories of the past but also reminders of past successes.
•The home affirms one’s self-worth; one fears (whether rightly or wrongly) that others will consider the person a “retirement failure” upon moving.
….
“The bitter truth is that an older person can succeed at remaining in her or his own home and still live a life as empty and difficult as that experienced by nursing home residents. Feeling compelled to stay in one’s home, no matter what, can result in dwindling choices and mounting levels of loneliness, helplessness, and boredom.”
This is a stark message. But here’s an even more discouraging problem: in my research on the issue, I encountered one repeated refrain. There is no solid scholarly research which asks the question: “which choice is the better one, in terms of future quality of life, to stay or to move?” It’s not an easy question, to be sure: simply looking at the quality of life of the elderly and comparing those who live in single-family homes vs. various kinds of “elder-friendly” housing would not adequately distinguish between those who moved due to some sort of health problem and those who moved with the aim of preventing future health problems, for example.
U.S. households that earn upward of $200,000 a year can have a significant impact when they move between states, despite their relatively small numbers, according to a recent analysis by SmartAsset. In 2020, these tax filers comprised 6.8% of total tax returns filed across the 50 States and the District of Columbia.
High-earning households’ influence is so great because a state that loses more of them than it gains in a given year may experience a decline in tax revenues and its fiscal situation may worsen.
As part of its analysis, SmartAsset identified the states with the most movement of high-earning households. Researchers examined the inflow and outflow of tax filers making at least $200,000 in each state and the District of Columbia between 2019 and 2020.
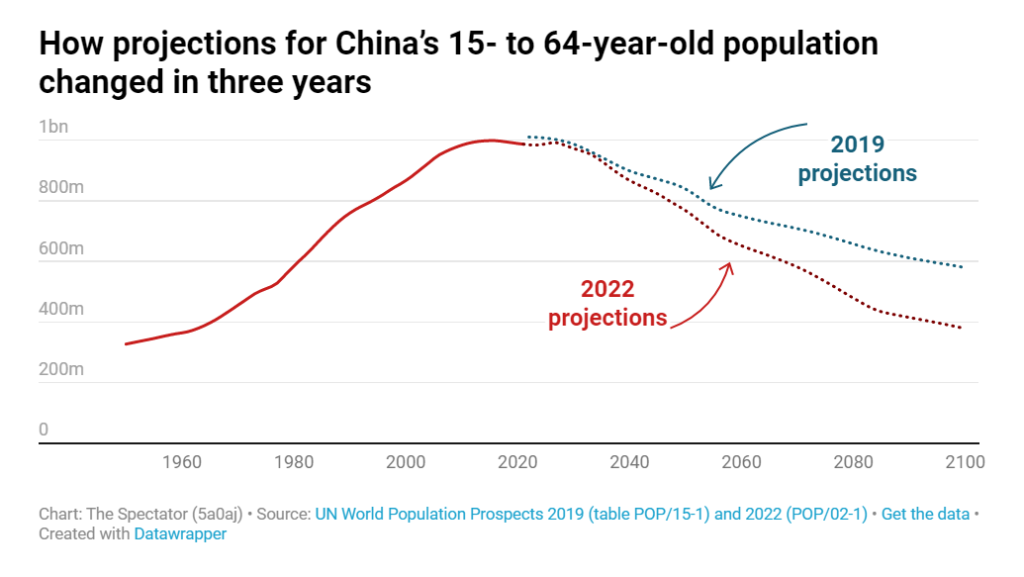
According to a new UN report, China’s population growth has collapsed by 94 per cent, from eight million a decade ago to just 480,000 last year. What’s particularly worrying for Chinese leaders is that this means a rapid reduction in the working population. The previous set of projected figures suggested that by the year 2100, China’s 15- to 64-year-old population would be 579 million. This has now been revised down to 378 million, a 35 per cent fall. If this prediction plays out, the implications for China – and the rest of the world – could be brutal.
Today, every 100 working-age Chinese need to support 20 retirees. If trends continue, by the turn of the next century, every 100 workers will have to support 120 retirees. This means China will have the largest drop in working-age population among any of the G20 economies by 2030, with more than 23 million fewer Chinese. In percentage terms, Japan and South Korea will shrink even faster – but they became rich before birth rates began plummeting.
For anti-racist dataviz, our most effective tool is context. The way that data is framed can make a very real impact on how it’s interpreted. For example, this case study from the New York Times shows two different framings of the same economic data and how, depending on where the author starts the X-Axis, it can tell 2 very different — but both accurate — stories about the subject.
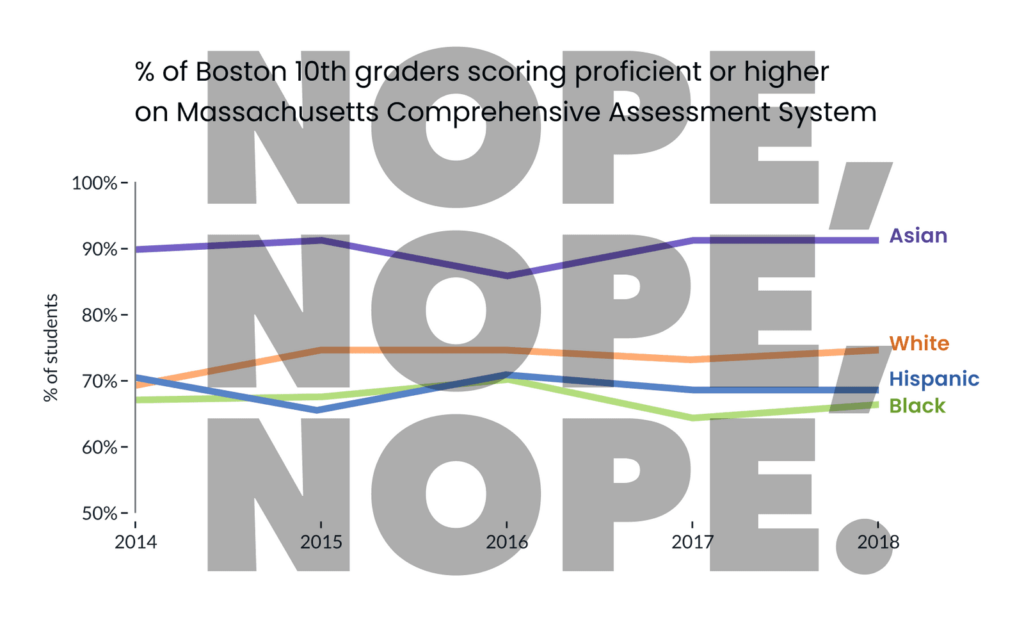
As Pieta previously highlighted, dataviz in spaces that address race / ethnicity are sensitive to “deficit framing.” That is, when it’s presented in a way that over-emphasizes differences between groups (while hiding the diversity of outcomes within groups), it promotes deficit thinking (see below) and can reinforce stereotypes about the (often minoritized) groups in focus.
In a follow up study, Eli and Cindy Xiong (of UMass’ HCI-VIS Lab) confirmed Pieta’s arguments, showing that even “neutral” data visualizations of outcome disparities can lead to deficit thinking (and therefore stereotyping) and that the way visualizations are designed can significantly impact these harmful tendencies.
Despite significant changes in the economy since the onset of the Great Attrition (or what many call the Great Resignation), the share of workers planning to leave their jobs remains unchanged from 2021, at 40 percent. That’s two out of five employees in our global sample who said that they are thinking about leaving in the next three to six months.
However, the past year has revealed nuances of the larger trend:
Reshuffling. Employees are quitting and going to different employers in different industries (48 percent of the job leavers in our sample). Some industries are disproportionately losing talent, others are struggling to attract talent, and some are grappling with both.
Reinventing. Many employees leaving traditional employment are either going to nontraditional work (temporary, gig, or part-time roles) or starting their own businesses. Of the employees who quit without a new job in hand, 47 percent chose to return to the workforce. However, only 29 percent returned to traditional full-time employment.
Reassessing. Many people are quitting not for other jobs but because of the demands of life—they need to care for children, elders, or themselves. These are people who may have stepped out of the workforce entirely, dramatically shrinking the readily available talent pool.
Author(s): Aaron De Smet, Bonnie Dowling, Bryan Hancock, and Bill Schaninger
We study aggregate lapsation risk in the life insurance sector. We construct two lapsation risk factors that explain a large fraction of the common variation in lapse rates of the 30 largest life insurance companies. The first is a cyclical factor that is positively correlated with credit spreads and unemployment, while the second factor is a trend factor that correlates with the level of interest rates. Using a novel policy-level database from a large life insurer, we examine the heterogeneity in risk factor exposures based on policy and policyholder characteristics. Young policyholders with higher health risk in low-income areas are more likely to lapse their policies during economic downturns. We explore the implications for hedging and valuation of life insurance contracts. Ignoring aggregate lapsation risk results in mispricing of life insurance policies. The calibrated model points to overpricing on average. In the cross-section, young, low-income, and high-health risk households face higher effective mark-ups than the old, high-income, and healthy.
Author(s): Ralph S. J. Koijen, Hae Kang Lee & Stijn Van Nieuwerburgh
USAA — a policyholder-owned insurer that has historically focused on serving military veterans and their relatives — may be the big U.S. life insurer with the lowest policy lapse rate.
A team of researchers led by Ralph S.J. Koijen has presented data supporting that conclusion in a new analysis of how economic slumps affect which insureds drop their life insurance.
To conduct that analysis, the Koijen team crunched data from the public financial reports of the 30 biggest U.S. life insurer groups, for a period from 1996 through 2020.
….
Overall, a severe crisis, such as the 2007-2009 Great Recession, might increase a company’s life policy lapse rate by about 1 percentage point or more, after holding other factors considered equal, the researchers concluded.
The researchers found that, after holding factors such as risk class, smoking use and type of coverage equal, being under age 35 increased the risk of letting a life policy lapse by 46%, and being ages 25 through 34 during an economic slump increase lapse risk by an additional 15%.
Over the past two decades, the U.S. maternal mortality rate has not improved while maternal mortality rates have decreased for other regions of the world. Furthermore, the rate at which women in the U.S. experience short-term or long-term negative health consequences due to unexpected outcomes of pregnancy or childbirth has also steadily increased over the past few decades, with nearly 50,000 women in the U.S. experiencing these health consequences in 2014. Significant racial and ethnic disparities persist in both the rate of women in the U.S. who die due to complications of pregnancy or delivery and the rate that women experience negative health consequences due to unexpected pregnancy or childbirth outcomes.
…..
Compared to any other racial or ethnic group,7 Black8 women experience the highest rates of nearly all of Centers for Disease Control and Prevention’s (CDC) severe maternal morbidity9 indicators.10 Black women in the U.S. are 3 to 4 times more likely to die from pregnancy-related complications than White11 women in the U.S., and Native American12 women are more than 2 times more likely to die from pregnancy-related complications than White women in the U.S.13 Pregnancy-related mortality is also slightly elevated for Asian women (a 1.1 disparity ratio),14 and for Hispanic women in some geographic areas.15 Moreover, the risk of pregnancy-related death is so elevated for Black women in certain regions of the U.S. that it is comparable to the
rate of pregnancy-related deaths16 in some developing countries.17 This racial disparity has not improved in decades,18 and is also seen in other middle to high-income countries with multiethnic populations.19 According to the World Health Organization (WHO), the U.S. maternal mortality ratio ranked 56th in the world in 2017.20 According to the National Center for Health Statistics (NCHS), in 2018, the maternal mortality rate in the U.S. was 17.4 maternal deaths per 100,000 live births, with 658 women dying of maternal causes.21 In 2019, the maternal mortality rate in the U.S. was 20.1 maternal deaths per 100,000 live births, with 754 women dying of maternal causes.
Heriot, Gail L., Dissenting Statement and Rebuttal of Commissioner Gail L. Heriot in U.S. Commission on Civil Right Report: Racial Disparities on Maternal Health (September 15, 2021). San Diego Legal Studies Paper 21-028, Available at SSRN: https://ssrn.com/abstract=3924645 or http://dx.doi.org/10.2139/ssrn.3924645
Abstract:
On September 15, 2021, the U.S. Commission on Civil Rights published a report entitled Racial Disparities in Maternal Health (the “Report”). This Dissenting Statement and Rebuttal (the “Statement”) is a part of that report.
Among other things, the Statement points out several errors in Report. For example, the Report incorrectly states that maternal mortality has increased 50% over the last generation. What has actually happened is that changes in death certificates have caused more deaths to be classified as maternal in nature. The Report also emphasizes the theory that racism plays a prominent role in causing racial disparities in maternal mortality. The Statement points out in response that maternal mortality rates for Hispanic and Asian American mothers are lower than the rate for white mothers. This tends to detract from the theory that racism is what’s causing the disparities.
Black pregnant women continue to face disproportionately high pregnancy-related deaths, with data from the Centers for Disease Control and Prevention indicating a 26 percent increase in the maternal mortality rate for Black women since the start of the pandemic.
Though researchers do not have an explanation for the disparities, the research suggests it’s a culmination of institutional racism and other health factors, such as the increased risk of obesity and hypertension in Black women. Howell also added that stress and a lack of access to quality prenatal care further exacerbates this issue.
“It really does boil down to how public health officials relate to Black women who are giving birth,” Howell said. “Statistics about Black maternal mortality are high across the board, no matter what your educational level is, no matter what your insurance level is.”
In 2018, tennis star Serena Williams opened up in an interview with Vogue magazine about encountering severe health complications after giving birth because doctors neglected to listen about her existing medical conditions.
“When you have someone like Serena Williams having problems giving birth, and not being treated properly by nurses and doctors when she complains about not feeling well, then you look at the doctor of someone who is poor in Louisiana, and has the same kind of problem — they are probably treated even worse,” Howell said.
1. Japan can defend its interest rate line by printing more money but at expense of the yen
2. Japan can defend the yen by hiking rates or by selling its reserves until reserves run out
Japan has a nasty choice
I received this email reply to the above Tweet from Michael Pettis.
“Looks right. I’d add that by weakening the yen, Japan seems always to support their exporters at the expense of their consumers, which may be why domestic demand is always so weak and growth so sluggish.“
The smart thing for Japan would be to hike rates and let the Yen strengthen.
Instead, if they stay on the same path, the yen might blow up.
All of Japan’s efforts to achieve growth by inflation and exports have backfired. One might think that after 40 years they would try something else.
The single worst choice for Japan would be to blow its currency reserves in an attempt to defend both the Yen and its interest rate peg.