Millions retired early during the pandemic. Many are now returning to work, new data shows.

Link: https://www.washingtonpost.com/business/2022/05/05/retirement-jobs-work-inflation-medicare/

Graphic:

Excerpt:

Roughly 2.4 million additional Americans retired in the first 18 months of the pandemic than expected, making up the majority of the 4.2 million people who left the labor force between March 2020 and July 2021, according to Miguel Faria-e-Castro, a senior economist at the Federal Reserve Bank of St. Louis.

The percentage of retirees returning to work has picked up momentum in recent months, hitting a pandemic high of 3.2 percent in March, according to Indeed. In interviews with nearly a dozen workers who recently “un-retired,” many said they felt comfortable returning to work now that they’ve gotten the coronavirus vaccine and booster shots. Almost all said they’d taken on jobs that were more accommodating of their needs, whether that meant being able to work remotely, travel less or set their own hours.

“This is primarily a story of a tight labor market,” said Bunker of Indeed, who added that there was a similar rebound in people returning from retirement after the Great Recession. “For so much of last year, the big question in the labor market was: Where are all the workers? This year we’re seeing that they’re coming back.”

Author(s): Abha Bhattarai

Publication Date: 6 May 2022

Publication Site: WaPo

Charted: The Global Decline of Fertility Rates

Link: https://www.visualcapitalist.com/cp/charted-the-global-decline-of-fertility-rates/

Graphic:

Excerpt:

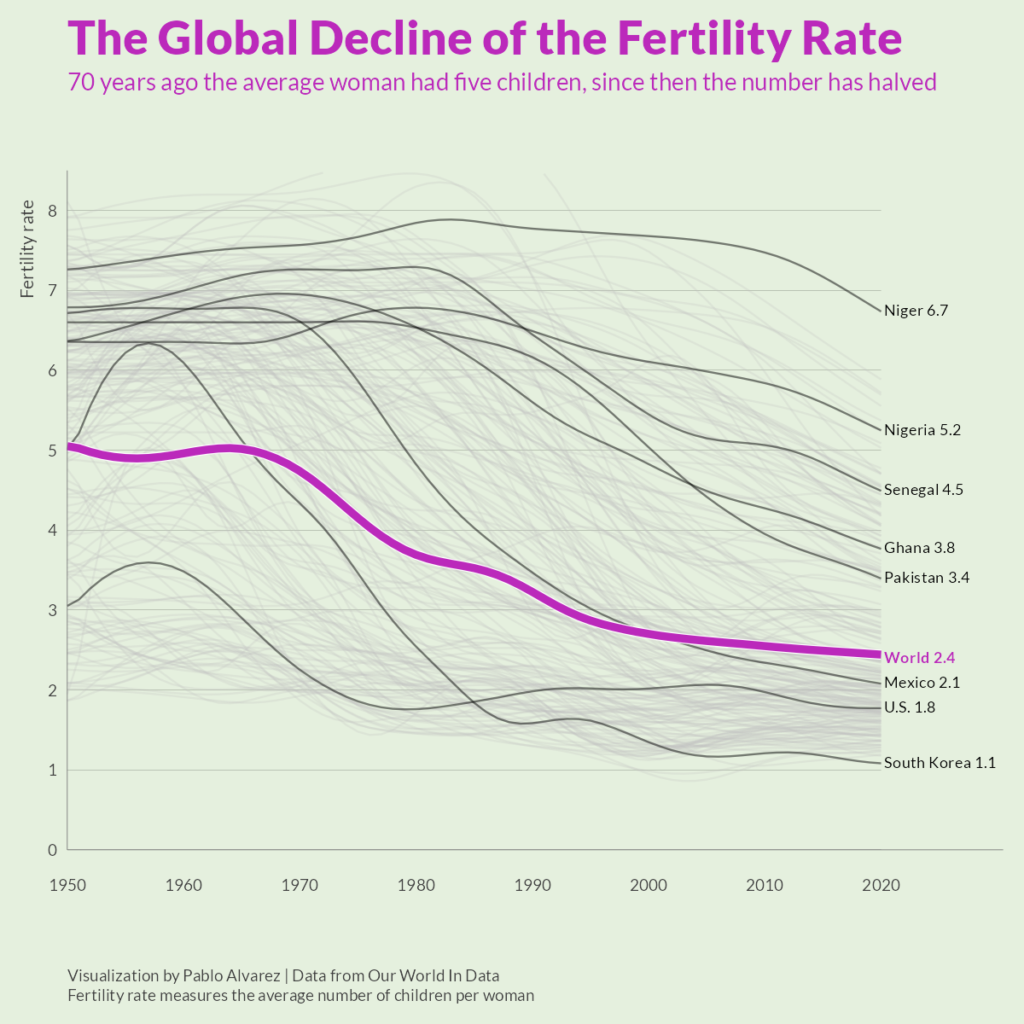
Over the last 50 years, fertility rates have dropped drastically around the world. In 1952, the average global family had five children—now, they have less than three.

This graphic by Pablo Alvarez uses tracked fertility rates from Our World in Data to show how rates have evolved (and largely fallen) over the past decades.

What’s The Difference Between Fertility Rates and Birth Rates?

Though both measures relate to population growth, a country’s birth rate and fertility rate are noticeably different:

  • Birth Rate: The total number of births in a year per 1,000 individuals.
  • Fertility Rate: The total number of births in a year per 1,000 women of reproductive age in a population.

Author(s): Pablo Alvarez

Publication Date: 10 Jun 2022

Publication Site: Visual Capitalist

As Pandemic Continues, More Older Adults Are Working — What’s Tempting Them?

Link: https://www.magnifymoney.com/news/working-older-adults-study/

Excerpt:

Amid the coronavirus pandemic, a rising share of adults 65 and older are working. In late April and early May 2020, 19.5% of Americans 65 and older were working. That figure jumped more than 2 percentage points in late April and early May 2022 to 21.9%. At the same time, the share of U.S. adults who reported that they’re retired is up similarly — from 14.9% in April and May 2020 to 17.4% in April and May 2022.

More than a quarter of working Americans 65 and older are self-employed. 25.6% of employed older Americans are self-employed — more than triple the rate among working Americans 25 to 39. Meanwhile, the government isn’t the landing spot it once was for older workers: In April and May 2020, 15.2% of employed Americans 65 and older worked for the government. In April and May 2022, however, that percentage plummeted by a third to 10.1%.

New Jersey saw the largest jump in older adults in the workforce since the beginning of the pandemic. In April and May 2020, 18.1% of Americans 65 and older were employed in New Jersey. By April and May 2022, that was up 18.9 percentage points to 37.0%. The other states with double-digit increases were West Virginia (17.2 percentage points) and Pennsylvania (14.6).

North Dakota saw the biggest dip in the percentage of adults 65 and older in the workforce. The rate of older working adults went from 36.0% in April and May 2020 to 25.0% in April and May 2022 — a drop of 11.0 percentage points. Other big drops were seen in Wisconsin (8.3 percentage points) and North Carolina (6.3).

Author(s): Alex Cook

Publication Date: 6 Jun 2022

Publication Site: Magnify Money

U.S. Births Increase for First Time Since 2014

Link: https://www.wsj.com/articles/u-s-births-increase-for-first-time-since-2014-11653364861

Graphic:

Excerpt:

U.S. births increased last year for the first time in seven years, according to federal figures out on Tuesday that offer the latest indication the pandemic baby bust was smaller than expected.

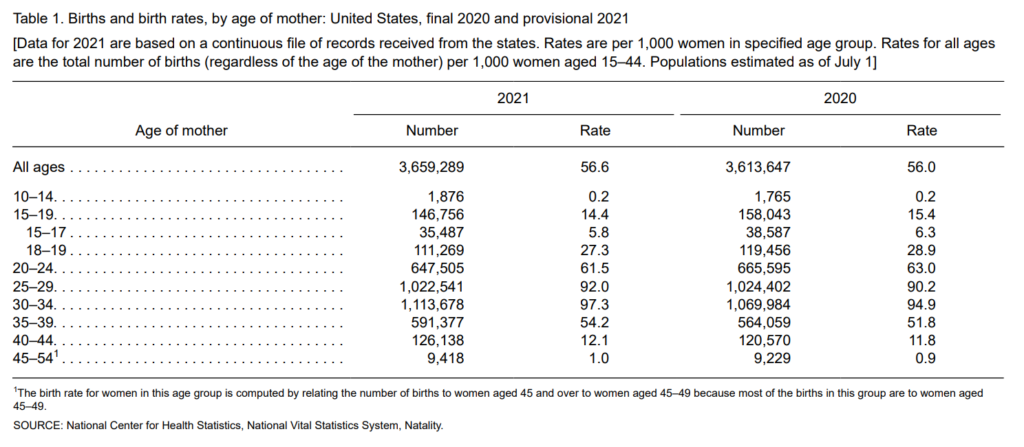
American women had about 3.66 million babies in 2021, up 1% from the prior year, according to provisional data from the Centers for Disease Control and Prevention’s National Center for Health Statistics. It was the first increase since 2014. The rebound spanned age groups, with birthrates rising for every cohort of women age 25 and older.

Births still remain at historically low levels after peaking in 2007 and then plummeting during the recession that began at the end of that year. The total fertility rate — a snapshot of the average number of babies a woman would have over her lifetime — was 1.66 last year, up from 1.64 the prior year, when it fell to the lowest level since the government began tracking it in the 1930s.

Author(s): Janet Adamy and Anthony DeBarros

Publication Date: 24 May 2022

Publication Site: WSJ

Births: Provisional Data for 2021

Link: https://www.cdc.gov/nchs/data/vsrr/vsrr020.pdf

Graphic:

Excerpt:

Methods—Data are based on 99.94% of all 2021 birth records received and processed by the National Center for Health Statistics as of February 10, 2022. Comparisons are made with final 2020 data and earlier years.

Results—The provisional number of births for the United States in 2021 was 3,659,289, up 1% from 2020 and the first increase in the number of births since 2014. The general fertility rate was 56.6 births per 1,000 women aged 15–44, up 1% from 2020 and the first increase in the rate since 2014. The total fertility
rate was 1,663.5 births per 1,000 women in 2021, up 1% from 2020. Birth rates declined for women in age groups 15–24, rose for women in age groups 25–49, and was unchanged for adolescents aged 10–14 in 2021. The birth rate for teenagers aged 15–19 declined by 6% in 2021 to 14.4 births per 1,000 females;
rates declined for both younger (aged 15–17) and older (aged 18–19) teenagers. The cesarean delivery rate rose to 32.1% in 2021; the low-risk cesarean delivery rate also rose to 26.3%. The preterm birth rate rose 4% in 2021 to 10.48%, the highest rate reported since 2007.

Author(s): Brady E. Hamilton, Ph.D., Joyce A. Martin, M.P.H., and Michelle J.K. Osterman, M.H.S.,
Division of Vital Statistics, National Center for Health Statistics

Publication Date: May 2022

Publication Site: CDC

Life Insurance Has an Inclusivity Problem

Link: https://www.thinkadvisor.com/2022/06/10/life-insurance-has-an-inclusivity-problem/

Excerpt:

Modern underwriting approaches and distribution methods, often spearheaded by insurtech companies, unlock unique, data-driven insights that enable the industry to understand who they’re serving well — and where they fall short.

The industry can use these insights to adopt a more personalized, progressive approach to product design, underwriting, and distribution to reach specific populations with coverage options and pricing that suits their unique needs.

For the LGBTQ+ community, historical rules and underwriting approaches around mental health could make coverage unattainable or unaffordable.

For example, while our survey didn’t ask respondents about treatment for mental health, the cost of health care in general was a primary concern for nearly 70% of respondents.

A study published in the National Library of Medicine found that LGBTQ+ people used mental health services at 2.5 times higher rates than heterosexual or cisgender individuals.

Additionally, studies have found that they are two and a half times more likely to experience depression, anxiety, and substance abuse — items that are all considered in the underwriting process for life insurance.

Since many in the LGBTQ+ community struggle with mental health concerns, we must find better ways to understand the situation and evaluate the risk holistically.

Author(s): Jeremy Bill

Publication Date: 10 Jun 2022

Publication Site: Think Advisor

Debtor Nation

Link: https://reason.org/debtor-nation/

Graphic:

Excerpt:

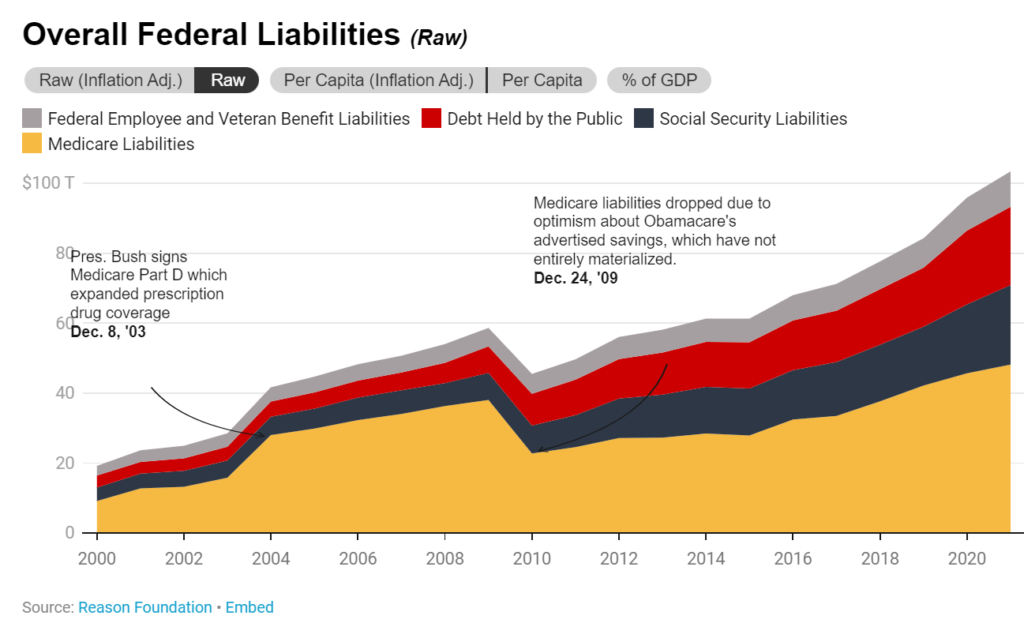
Organizations incur long-term financial obligations in forms other than bonds and the U.S. federal government is no exception. Some common types of financial obligations include pension and retiree health care costs for veterans, civilian federal employees, and the general public (through Social Security and Medicare benefit commitments). Looking at the federal government’s balance sheet as of 2021, public holdings of U.S. Treasury securities make up less than one-quarter of total federal liabilities. Unfunded entitlements, like Medicare and Social Security, account for the most at 59% of obligations.

Overall federal obligations have now surpassed $300,000 per American. While substantial in their own right, the debt obligations of state and local governments across the country are dwarfed by the various categories of federal debt.

Author(s): Jordan Campbell, Marc Joffe

Publication Date: 16 May 2022

Publication Site: Reason

Mapped: A Decade of Population Growth and Decline in U.S. Counties

Link: https://www.visualcapitalist.com/mapping-a-decade-of-us-population-growth/

Graphic:

Excerpt:

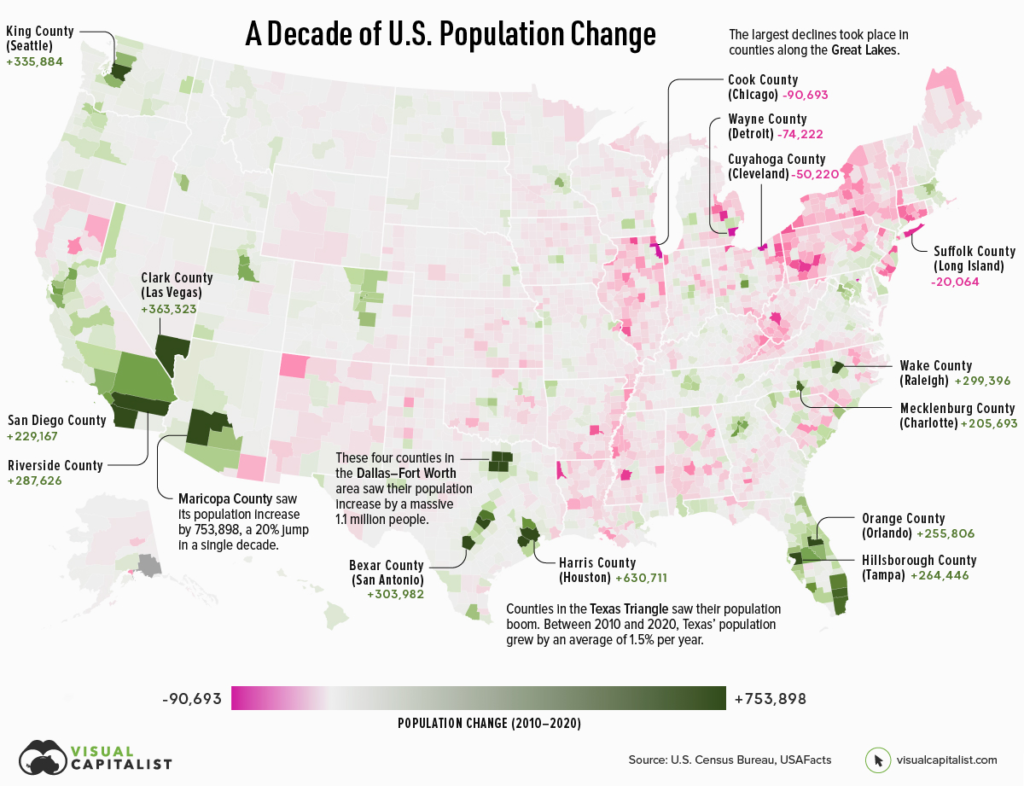
If an area sees a high number of migrants, along with a strong birth rate and low death rate, then its population is bound to increase over time. On the flip side, if more people are leaving the area than coming in, and the region’s birth rate is low, then its population will likely decline.

Which areas in the United States are seeing the most growth, and which places are seeing their populations dwindle?

This map, using data from the U.S. Census Bureau, shows a decade of population movement across U.S. counties, painting a detailed picture of U.S. population growth between 2010 and 2020.

Author(s): Nick Routley
Article/Editing: Carmen Ang

Publication Date: 16 Jun 2022

Publication Site: Visual Capitalist

CAS Releases Two Additional Papers in Race and Insurance Pricing Series

Link: https://www.casact.org/article/cas-releases-two-additional-papers-race-and-insurance-pricing-series

Excerpt:

Arlington, VA – Two new research reports designed to guide the insurance industry toward proactive, quantitative solutions to identify, measure and address potential racial bias in insurance pricing were published by the Casualty Actuarial Society (CAS) today.

“These two new reports in our CAS Research Series on Race and Insurance Pricing continue to provide additional insight into industry discussions on this topic,” said Victor Carter-Bey, DM, CAS chief executive officer. “We hope with this series to serve as a thought leader and role model for other insurance organizations and corporations in promoting fairness and progress.”

As the professional society of actuaries specializing in property and casualty insurance, the CAS is committed to diversity, equity and inclusion in actuarial work. To this end, the Society is releasing a series of four CAS Research Papers, which support the CAS’s Approach to Race and Insurance Pricing. This approach was adopted by the CAS Board of Directors in December 2020 and includes four key areas of focus and goals: basic and continuing education, research, leadership and influence, and collaboration. Each paper in the series addresses a different aspect of race and insurance pricing as viewed through the lens of property and casualty insurance.

Two of the four reports in the CAS Research Paper Series on Race and Insurance PricingUnderstanding Potential Influences of Racial Bias on P&C Insurance: Four Rating Factors Explored and Defining Discrimination in Insurance, are being released today. Here is a more detailed description of the two reports published today:

Defining Discrimination in InsuranceThis report examines terms that are being used in discussions around potential discrimination in insurance, including protected class, unfair discrimination, proxy discrimination, disparate impact, disparate treatment, and disproportionate impact. The paper provides historical and practical context for these terms and illustrates the inconsistencies in how different stakeholders define them. It also describes the potential impacts of these definitions on actuarial work.

Understanding Potential Influences of Racial Bias on P&C Insurance: Four Rating Factors ExploredThe paper examines four commonly used rating factors to understand how the data underlying insurance pricing models may be impacted by racially biased policies and practices outside of insurance. The goal is to highlight the multi-dimensional impacts of systemic racial bias, as it may relate to insurance pricing. The four factors included in the report are: Credit-Based Insurance Score (CBIS), geographic location, homeownership and Motor Vehicle Records.

The other two reports, Methods for Quantifying Discriminatory Effects on Protected Classes in Insuranceand Approaches to Address Racial Bias in Financial Services: Lessons for the Insurance Industry, were released March 10, 2022 during a virtual briefing.  

These four research reports are just one way the CAS supports evolving actuarial practices and strengthens the knowledge of its members. The papers demonstrate the Society’s recognition that actuaries—who are responsible for setting insurance rates—must be a voice in an ever-evolving dialogue. The CAS understands that this work is critical to maintaining the Society and its members’ public trust.

Publication Date: 31 Mar 2022

Publication Site: CAS

A Widening Gap in Life Expectancy Makes Raising Social Security’s Retirement Age a Particularly Bad Deal for Low-Wage Earners

Link: https://sections.soa.org/publication/?m=58953&i=668685&view=articleBrowser&article_id=3731911&ver=html5

Graphic:

Excerpt:

Many recent studies find the life expectancy gap is growing. By how much depends on how and when it’s measured. In 2014, the Congressional Budget Office (CBO) calculated that a 65-yearold man in the upper quintile (fifth) of life earnings could be expected to live more than three years longer than a similar man in the lowest quintile. By 2039, the difference would double to six years.

In a 2015 report, the National Academy of Sciences compared the 1930 and 1960 birth cohorts and found that life expectancy for the bottom quintile of men at age 50 decreased slightly to 26.1 years over the 30-year period. Meanwhile, life expectancy rose for men age 50 in higher-income quintiles. As shown in Figure 1, the life expectancy gap between the bottom (quintile 1) and top fifth of the income distribution widened from 5.1 to 12.7 years. In 2016, a Brookings study found, for men born in 1940, those in the lowest income decile at age 50 could expect to live to be about 76 years old compared with 88 years for the highest income decile. Another research team, led by Raj Chetty, found that disparity in longevity continued to increase over 2001–2014; the average gap between the bottom and top 1 percent was 14.6 years for men and 10.1 years for women.

Author(s): Karl Polzer

Publication Date: August 2020

Publication Site: In the Public Interest, SOA

Visualizing the Coming Shift in Global Economic Power (2006-2036p)

Link: https://www.visualcapitalist.com/shifting-global-economic-power/

Graphic:

Excerpt:

China is expected to surpass the U.S. by the year 2030. A faster than expected recovery in the U.S. in 2021, and China’s struggles under the “Zero-COVID” policies have delayed the country taking the top spot by about two years.

China has maintained its positive GDP growth due to the stability provided by domestic demand. This has proven crucial in sustaining the country’s economic growth. China’s fiscal and economic policy had focused on this prior to the pandemic over fears of growing Western trade restrictions.

Author(s): Raul Amoros

Publication Date: 13 Jun 2022

Publication Site: Visual Capitalist