Why Aren’t More People Claiming Government Benefits?

Link: https://knowledge.wharton.upenn.edu/article/why-arent-more-people-claiming-government-benefits/

Excerpt:

When the Biden administration expanded the Child Tax Credit in 2021 with direct cash payments of up to $3,600 to alleviate child poverty, millions of the most vulnerable families never received the automatic payments because they didn’t have a digital connection with the Internal Revenue Service through a previous income tax filing online. The burden was on those families to seek out the public benefit.

To boost awareness, the government launched a messaging campaign to let families know that up to $3,600 a year was waiting for them. But months later, millions of dollars were still unclaimed.

A new study led by Wharton marketing professor Wendy De La Rosa pinpoints the reason why so many Americans left money on the table: The large amount seemed like an abstraction because people don’t think about money on a yearly basis. Through a series of experiments, the researchers found that people were more likely to collect the money if it was conveyed as a monthly or weekly amount — $300 or $69 — similar to how they budget.

Author(s): Angie Basiouny

Publication Date: 11 Oct 2022

Publication Site: Knowledge @ Wharton

The Economic Cost of Gun Violence

Link: https://everytownresearch.org/report/the-economic-cost-of-gun-violence/

Graphic:

Excerpt:

  • Taxpayers, survivors, families, and employers pay an average of $7.79 million daily in health care costs, including immediate and long-term medical and mental health care, plus patient transportation/ambulance costs related to gun violence, and lose an estimated $147.32 million per day related to work missed due to injury or death. 
  • American taxpayers pay $30.16 million every day in police and criminal justice costs for investigation, prosecution, and incarceration. 
  • Employers lose an average of $1.47 million on a daily basis in productivity, revenue, and costs required to recruit and train replacements for victims of gun violence.
  • Society loses $1.34 billion daily in quality-of-life costs from the suffering and lost well-being of gun violence victims and their families.

Author(s):

Publication Date: 19 July 2022

Publication Site: Everytown Research

Reductions in US life expectancy during the COVID-19 pandemic by race and ethnicity: Is 2021 a repetition of 2020?

Link: https://www.ncbi.nlm.nih.gov/pmc/articles/PMC9432732/

Graphic:

Abstract:

COVID-19 had a huge mortality impact in the US in 2020 and accounted for most of the overall reduction in 2020 life expectancy at birth. There were also extensive racial/ethnic disparities in the mortality impact of COVID-19 in 2020, with the Black and Latino populations experiencing reductions in life expectancy at birth over twice as large as that of the White population. Despite continued vulnerability of these populations, the hope was that widespread distribution of effective vaccines would mitigate the overall mortality impact and reduce racial/ethnic disparities in 2021. In this study, we quantify the mortality impact of the COVID-19 pandemic on 2021 US period life expectancy by race and ethnicity and compare these impacts to those estimated for 2020. Our estimates indicate that racial/ethnic disparities have persisted, and that the US population experienced a decline in life expectancy at birth in 2021 of 2.2 years from 2019, 0.6 years more than estimated for 2020. The corresponding reductions estimated for the Black and Latino populations are slightly below twice that for Whites, suggesting smaller disparities than those in 2020. However, all groups experienced additional reductions in life expectancy at birth relative to 2020, and this apparent narrowing of disparities is primarily the result of Whites experiencing proportionately greater increases in mortality in 2021 compared with the corresponding increases in mortality for the Black and Latino populations in 2021. Estimated declines in life expectancy at age 65 increased slightly for Whites between 2020 and 2021 but decreased for both the Black and Latino populations, resulting in the same overall reduction (0.8 years) estimated for 2020 and 2021.

Author(s): Theresa Andrasfay, Noreen Goldman

Publication Date: 31 Aug 2022

Publication Site: PLOS ONE

Citation: Andrasfay T, Goldman N. Reductions in US life expectancy during the COVID-19 pandemic by race and ethnicity: Is 2021 a repetition of 2020? PLoS One. 2022 Aug 31;17(8):e0272973. doi: 10.1371/journal.pone.0272973. PMID: 36044413; PMCID: PMC9432732.

Solvency And Sustainability Of Social Security

Link:https://www.lifehealth.com/solvency-and-sustainability-of-social-security/

Graphic:

Excerpt:

2021 Costs Exceed Income

As seen from subtracting the total cost shown in Table 2 from the total income shown in Table 1, Social Security paid out $56.3 billion more in benefits and expenses than it collected in income.

Because Social Security has trust funds, the total costs of 2021 were still met. However, the trust funds declined in 2021 by the $56.3 billion that costs exceeded income. At the end of 2020, the trust funds totaled $2,908.3 billion, and at the end of 2021, the trust funds totaled $2,852.0 billion.

Solvency

As highlighted in the Academy’s issue brief An Actuarial Perspective on the 2022 Social Security Trustees Report, the 2022 Trustees Report contains key solvency facts about the system:

  • Social Security costs continue to be projected to exceed the income of the program, until the trust funds are projected to become depleted during 2035.
  • If changes to the program are not implemented before 2035, 80% of scheduled benefits would be payable after depletion of the trust funds in 2035, declining to 74% by 2096.

Author(s): Amy Kemp, MAAA, ASA, EA

Publication Date: October 2022

Publication Site: Advisor Magazine

The most common restaurant cuisine in every state, and a chain-restaurant mystery

Link: https://www.washingtonpost.com/business/2022/09/29/chain-restaurant-capitals/

Graphic:

Excerpt:

The places that drive the most tend to have the same high share of chain restaurants regardless of whether they voted for Trump or Biden. As car commuting decreases, chain restaurants decrease at roughly the same rate, no matter which candidate most residents supported.

If the link between cars and chains transcends partisanship, why does it look like Trump counties have more chain restaurants? It’s at least in part because he won more of the places with the most car commuters!

About 83 percent of workers commute by car nationally, but only 80 percent of folks in Biden counties do so, compared with 90 percent of workers in Trump counties. The share of car commuters ranges from 55 percent in the deep-blue New York City metro area to 96 percent around bright red Decatur, Ala.

Author(s): Andrew Van Dam

Publication Date: 1 Oct 2022

Publication Site: WaPo

Young Versus Old Will Define Fight Over Public Pensions

Link:https://www.washingtonpost.com/business/young-versus-old-will-define-fight-over-public-pensions/2022/10/06/d4fae69a-4566-11ed-be17-89cbe6b8c0a5_story.html

Excerpt:

Younger workers are mostly excluded from those benefits, and few believe pension funds will be around to pay them at retirement time anyway. So younger workers want salary increases rather than promises. Also, portable, employee-directed accounts like 401(k)s rather than large and ever-increasing contributions to black-hole public pension systems. The fight in 2023 may be more between younger and older public employees than between united public employees and taxpayers.I think young employees will score their first victory after many years of getting pushed down. It will be short-term inflation then that applies lethal pressure in a tight labor market, not stock prices, interest rates or even longer-term expectations of price increases. Wages will have to be raised for public employees, who will refuse burdens from past underfunding or benefit cuts that apply only to them. The alternative is unacceptable declines in public services as the best employees quit, job openings go unfilled and qualifications for new hires are lowered.The most heavily indebted states, with the worst credit ratings and biggest pension funding shortfalls, may not be able to pay these increases. While 2022 should be a good revenue year for a majority of state and local governments, heavily indebted states with big pension-funding gaps need to brace for some serious headwinds. Illinois already spends 11% of its revenue to service debt. Increased yields on its bonds could double that to 22% as debt is refinanced, even if the state runs balanced budgets.

The temptation to cut benefits for retirees may be overwhelming. While these people can (and will) yell and scream, that’s easier to accept than a teachers’ strike or a police slowdown. Current employees can be offered generous wage increases and portable pensions. Reducing actuarial pension liabilities will please creditors and rating agencies. Taxpayers will appreciate being spared. In many states, cutting benefits will require a constitutional amendment or other legal heavy lifting, but with enough incentive, that can be done.

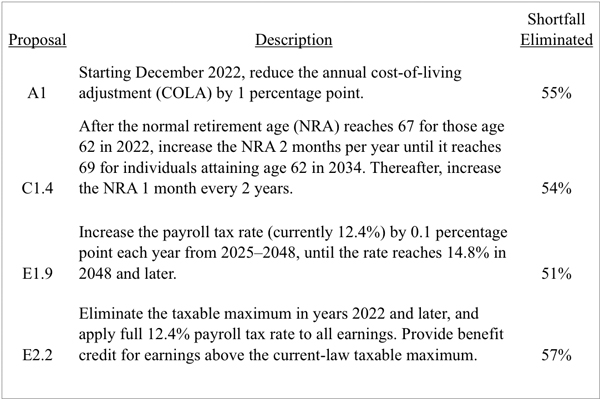
I expect something like Social Security reforms. A cap will cut benefits for people receiving the highest pensions, and states will put tax surcharges on benefits for high-income people even if they have moved out-of-state. Copays and deductibles will be increased for health coverage.

The first state to try this will face strong legal challenges, a nationwide union counteroffensive and significant in-state political resistance. But with enough fiscal pressure it may happen. If state administrations can keep current public employees on the sidelines, via wage increases and benefit restructuring, it might succeed.

Author(s): Aaron Brown, Bloomberg

Publication Date: 6 Oct 2022

Publication Site: Washington Post

Massachusetts’ Graduated Income Tax Amendment Threatens the Commonwealth’s Economic Transformation

Link: https://taxfoundation.org/massachusetts-graduated-income-tax-amendment/

Graphic:

Excerpt:

Massachusetts is already trending in the wrong direction in terms of migration. Since 2013, Massachusetts’ net population change levels have been trending downward; and in 2020 the Commonwealth realized its first net negative population change since 2004. Massachusetts lost an estimated 1,309 residents in 2020 but that figure grew to 37,497 by 2021. Much of that change is likely attributable to various changes brought on by the pandemic, including the expansion of remote work opportunities. However, Massachusetts’ struggle with migration precedes the pandemic.

The Bay State’s net migration levels generally mirror the downward trajectory of the net population change figures, but a closer look reveals that Massachusetts was experiencing net negative migration even before the pandemic began. The downward trend for net migration reached net negative levels in 2019, the first year since 2007.

Whether Massachusetts’ net migration figure is positive or negative primarily depends on the strength of net international migration. For 20 of the last 22 years, Massachusetts has seen net negative domestic migration. What this effectively means is that it is preferable to migrate to Massachusetts from abroad, but once a person lives there, it is preferable to move somewhere else. Between July 1, 2020 and July 1, 2021, an estimated 12,675 more people moved to the Bay State from abroad than left for foreign destinations. However, 46,187 more people left Massachusetts for other domestic locations than moved in from elsewhere in the United States.[14] This should concern policymakers, but the figure that should be even more concerning is the net outmigration of adjusted gross income (AGI).

Author(s): Timothy Vermeer

Publication Date: 13 Sept 2022

Publication Site: Tax Foundation

Government Worker Shortages Worsen Crisis Response

Link: https://www.governing.com/work/government-worker-shortages-worsen-crisis-response

Graphic:

Excerpt:

States and cities all over the country have seen a loss of workers over the past several years, and many are struggling to hire new ones. According to the Bureau of Labor Statistics, state and local governments lost more than 600,000 workers between the start of the pandemic and June of this year. Those shortages have begun to affect basic services, including many that are critical to safety and quality of life. According to a Center for American Progress report from March, there were 10,000 fewer water and wastewater treatment plant operators in 2021 than there were in 2019.

…..

The obvious reason why governments have struggled to hire and retain workers over the past few years, says Brad Hershbein, senior economist and deputy director of research at the W.E. Upjohn Institute for Employment Research, is that they can’t improve pay rates as quickly as the private sector can in response to worker demands for better wages. Another reason is that lots of government work has become newly politicized during the pandemic — public workers can be “heroes one day and villains the next,” he says. And a third factor is that staff shortages tend to make work that much more difficult for people who remain, contributing to unattractive working conditions.

“The burnout gets worse,” Hershbein says. “You get a spiral, where fewer people are stuck trying to handle the same amount of work and the whole thing collapses. That’s a real risk at a lot of agencies.”

Author(s): Jared Brey

Publication Date: 3 Oct 2022

Publication Site: Governing

Women now outnumber men in the U.S. college-educated labor force

Link: https://www.pewresearch.org/fact-tank/2022/09/26/women-now-outnumber-men-in-the-u-s-college-educated-labor-force/

Graphic:

Excerpt:

In the second quarter of 2022, the labor force participation rate for college-educated women was 69.6%, the same as in the second quarter of 2019. In contrast, men and most other educational groups now have lower rates of labor force participation than they did in the second quarter of 2019.

This shift in the college-educated labor force – as women now comprise a majority – comes around four decades after women surpassed men in the number of Americans earning a bachelor’s degree each year.

Author(s): Richard Fry

Publication Date: 26 Sept 2022

Publication Site: Pew Research Center

Using First Name Information to Improve Race and Ethnicity Classification

Link: https://papers.ssrn.com/sol3/papers.cfm?abstract_id=2763826

Graphic:

Abstract:

This paper uses a recent first name list to improve on a previous Bayesian classifier, the Bayesian Improved Surname Geocoding (BISG) method, which combines surname and geography information to impute missing race and ethnicity. The proposed approach is validated using a large mortgage lending dataset for whom race and ethnicity are reported. The new approach results in improvements in accuracy and in coverage over BISG for all major ethno-racial categories. The largest improvements occur for non-Hispanic Blacks, a group for which the BISG performance is weakest. Additionally, when estimating disparities in mortgage pricing and underwriting among ethno-racial groups with regression models, the disparity estimates based on either BIFSG or BISG proxies are remarkably close to those based on actual race and ethnicity. Following evaluation, I demonstrate the application of BIFSG to the imputation of missing race and ethnicity in the Home Mortgage Disclosure Act (HMDA) data, and in the process, offer novel evidence that race and ethnicity are somewhat correlated with the incidence of missing race/ethnicity information.

Author(s):

Ioan Voicu
Office of the Comptroller of the Currency (OCC)

Publication Date: February 22, 2016

Publication Site: SSRN

Suggested Citation:

Voicu, Ioan, Using First Name Information to Improve Race and Ethnicity Classification (February 22, 2016). Available at SSRN: https://ssrn.com/abstract=2763826 or http://dx.doi.org/10.2139/ssrn.2763826

SOA Diversity Report

Link: https://www.soa.org/4a79dc/globalassets/assets/files/static-pages/about/diversity-inclusion/summer-2022-diversity-report.pdf

Graphic:

Excerpt:

The Society of Actuaries (SOA) leadership and staff work closely with the Diversity, Equity, and Inclusion Committee (DEIC) to support the journey to increase diversity in membership and in the actuarial profession, as part of the SOA’s Long-Term Growth Strategy.

We strive for transparency and accountability in our DEI efforts and are committed to sharing our demographic data and long-term goals to support our pledge and responsibility. We have collected member voluntary demographic data since 2015. With this data, we present an infographic for the pathway from aspiring actuaries to members with ASA or FSA designations.

Author(s): Society of Actuaries

Publication Date: Summer 2022

Publication Site: Society of Actuaries

Forward Thinking on talent, state capacity, and being hopeful with Tyler Cowen

Link: https://www.mckinsey.com/capabilities/people-and-organizational-performance/our-insights/forward-thinking-on-talent-state-capacity-and-being-hopeful-with-tyler-cowen

Graphic:

Excerpt:

Michael Chui: Fascinating. You mentioned talent. You recently coauthored a book with Daniel Gross entitled Talent: How to Identify Energizers, Creatives, and Winners Around the World. What was the central thesis of this book?

Tyler Cowen: That talent is remarkably important. That we’re doing a poor job, misallocating talent. And there are a variety of ways, outlined in the book, we can do better. This book tries to be “the” talent book: a one-stop shopping guide to how to think about identifying talent.

Michael Chui: What are the macro implications of [the] lack of good matching? Is this a potential for accelerating productivity, for instance?

Tyler Cowen: We have slower economic growth when we don’t match talent well. We have a lower level of per capita income. When a recession comes, as was the case in 2008, labor markets adjust much more slowly. The consequences for human welfare are considerable.

Author(s): Michael Chui, Tyler Cowen

Publication Date: 28 Sept 2022

Publication Site: McKinsey