Report: https://crr.bc.edu/wp-content/uploads/2022/08/wp_2022-10.pdf
Graphic:
Abstract:
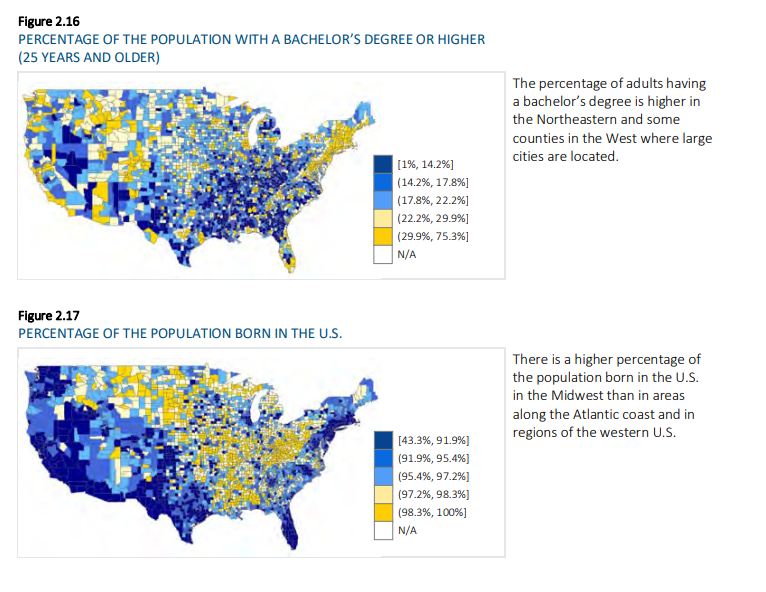
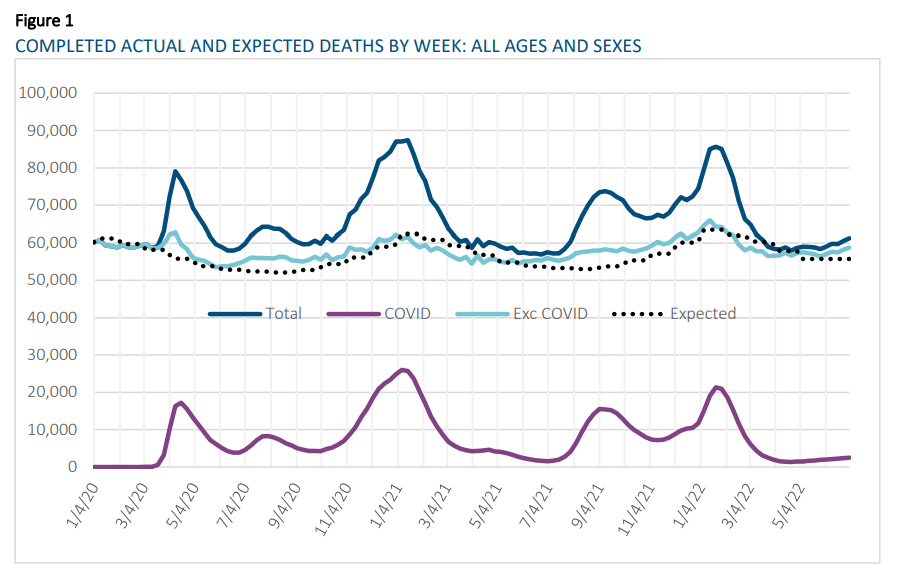
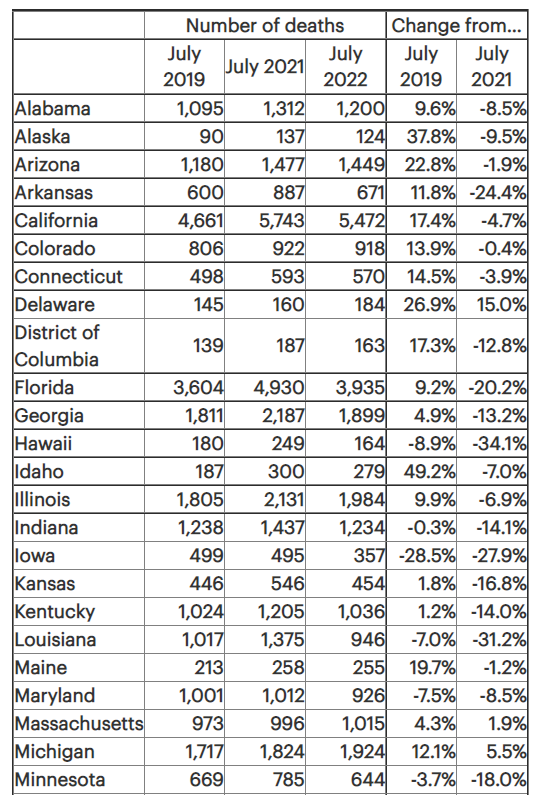
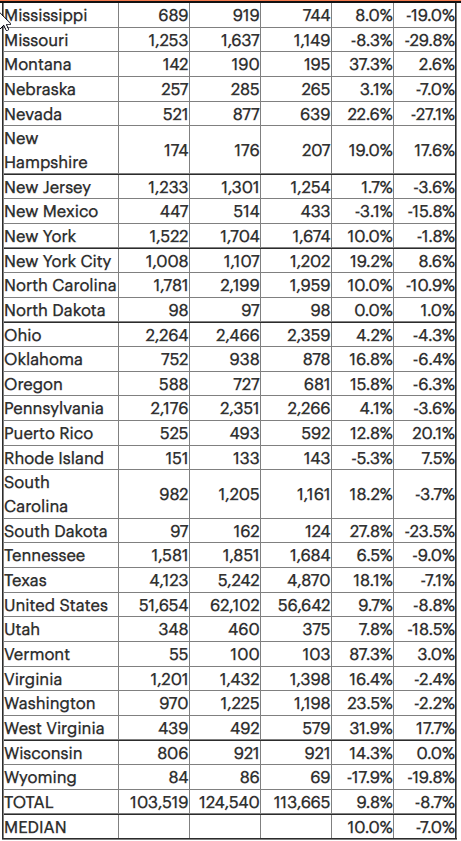
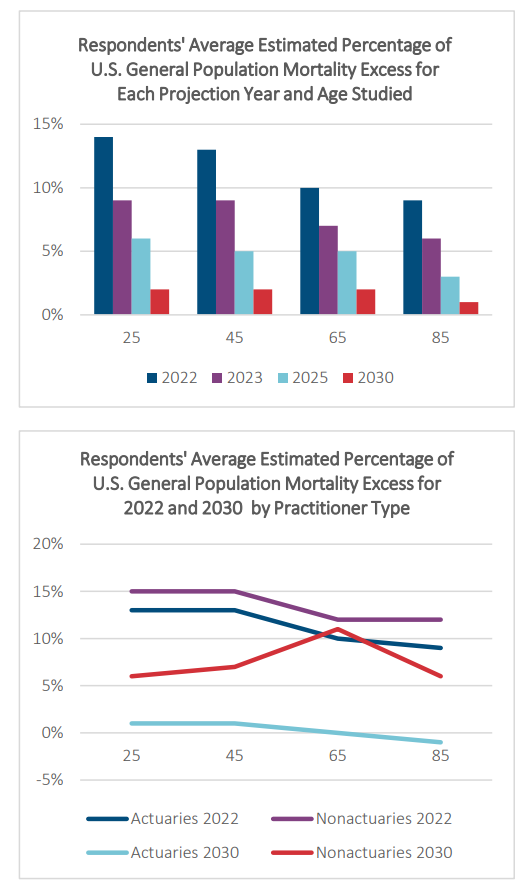
The mortality burden of the COVID-19 pandemic was particularly heavy among older adults, racial and ethnic minorities, and those with underlying health conditions. These groups are known to have higher mortality rates than others even in the absence of COVID. Using data from the 2019 American Community Survey, the 2018 Health and Retirement Study, and the 2020 National Vital Statistics System, this paper estimates how much lower the overall mortality rate will be for those who lived through the acute phase of the early pandemic after accounting for this selection effect of those who died from COVID. Such selection may have implications for life insurance and annuity premiums, as well as assessments of the financial standing of Social Security – if the selection is large enough to substantially alter projected survivor mortality.
The paper found that:
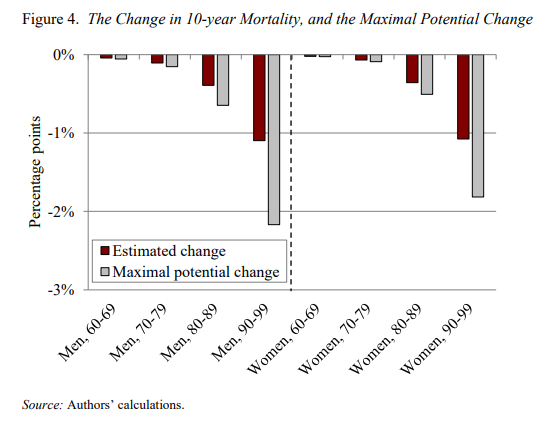
- 10-year mortality rates, absent direct COVID deaths and long COVID, will likely be lower in 2021 than anticipated in 2019.
- However, these differences are small, ranging from a decline of 0.4 percentage points for people in their 60s to 1 percentage point for those in their 90s.
- The small difference is in spite of the fact that COVID mortality was, indeed, very selective, with mortality declines exceeding half the maximum possible declines, holding total COVID deaths constant, for every age group.
The policy implications of the findings are:
- That declines in mortality due to COVID selection likely will not impact overall population mortality substantially enough to affect Social Security cost projections.
- Any impact of selection effects on Social Security costs will likely be swamped by ongoing mortality increases directly attributable to acute and long COVID.
Author(s): Gal Wettstein, Nilufer Gok, Anqi Chen, Alicia H. Munnell
Publication Date: August 2022
Publication Site: Center for Retirement Research at Boston College