The Myth of the Disease-Ridden Red States

Link: https://brownstone.org/articles/the-myth-of-the-disease-ridden-red-states/

Graphic:

Excerpt:

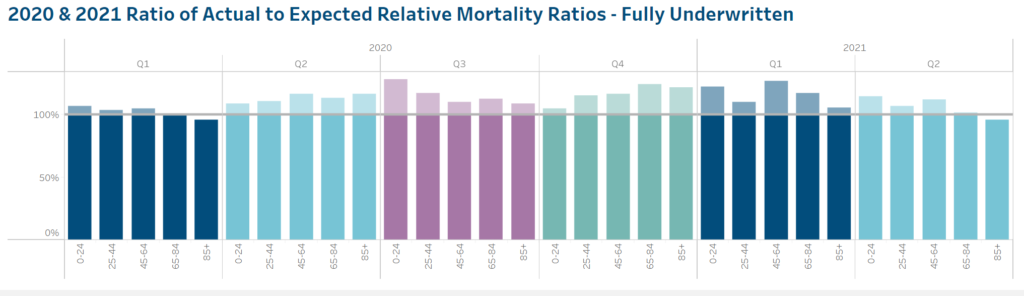
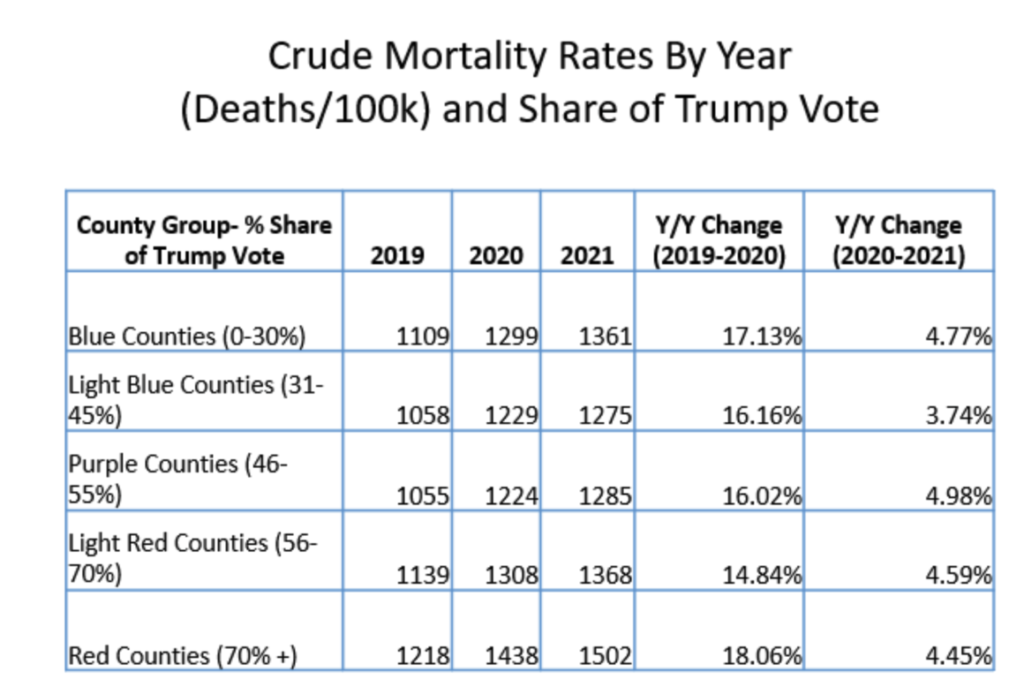
Another way of looking at this is to look at the Year over Year change of rates within each group. As you can see from the chart below, the percentage change remains pretty consistent among each individual grouping, with 2020 seeing the largest change rate, and 2021 seeing a small but significant change rate from 2020 (meaning overall mortality was still quite elevated relative to 2019).

In summary, when we take a historical view and higher level view while maintaining these same groupings, these stark differences in Covid-19 mortality rates do not seem to translate into overall morality rates. Why?


At the risk of this analysis turning into another pile-on pointing out the New York Time’s errors, I’d like to offer a more benign explanation. It’s one that has plagued journalists and reports throughout the pandemic. Why is it that everything is framed in Red and Blue? One simple reason: the availability of the data. Leonhardt is using data that is easily accessible and is already formatted for easy analysis.

This is what is called an availability bias. It’s essentially creating a hypothesis or completing a study based on a specific set of data, purely for no other reason than that the data is there. Just because the data is available does not mean it’s the best data to use to try to answer a question.

Author(s): Josh Stevenson

Publication Date: 3 June 2022

Publication Site: Brownstone Institute

A Widening Gap in Life Expectancy Makes Raising Social Security’s Retirement Age a Particularly Bad Deal for Low-Wage Earners

Link: https://sections.soa.org/publication/?m=58953&i=668685&view=articleBrowser&article_id=3731911&ver=html5

Graphic:

Excerpt:

Many recent studies find the life expectancy gap is growing. By how much depends on how and when it’s measured. In 2014, the Congressional Budget Office (CBO) calculated that a 65-yearold man in the upper quintile (fifth) of life earnings could be expected to live more than three years longer than a similar man in the lowest quintile. By 2039, the difference would double to six years.

In a 2015 report, the National Academy of Sciences compared the 1930 and 1960 birth cohorts and found that life expectancy for the bottom quintile of men at age 50 decreased slightly to 26.1 years over the 30-year period. Meanwhile, life expectancy rose for men age 50 in higher-income quintiles. As shown in Figure 1, the life expectancy gap between the bottom (quintile 1) and top fifth of the income distribution widened from 5.1 to 12.7 years. In 2016, a Brookings study found, for men born in 1940, those in the lowest income decile at age 50 could expect to live to be about 76 years old compared with 88 years for the highest income decile. Another research team, led by Raj Chetty, found that disparity in longevity continued to increase over 2001–2014; the average gap between the bottom and top 1 percent was 14.6 years for men and 10.1 years for women.

Author(s): Karl Polzer

Publication Date: August 2020

Publication Site: In the Public Interest, SOA

Naked mole rats defy the biological law of aging

Link: https://www.science.org/content/article/naked-mole-rats-defy-biological-law-aging

Excerpt:

The first study to analyze the life histories of thousands of naked mole rats has found that their risk of death doesn’t go up as they grow older, as it does for every other known mammalian species. Although some scientists caution against any sweeping conclusions, many say the new data are important and striking.

“This is remarkably low mortality,” says Caleb Finch, a biogerontologist at the University of Southern California in Los Angeles who was not involved in the new study. “At advanced ages, their mortality rate remains lower than any other mammal that has been documented.”

Scientists have long noted that naked mole rats—burrowing rodents with wrinkled, pink skin and large protruding teeth that live in large, subterranean colonies—show few signs of aging and far surpass the life span expected of a rodent this size. Mice in captivity live at most 4 years; based on their size, naked mole rats would not be expected to live past 6 years. Instead, some live beyond 30 years, and even at that age breeding females stay fertile.

Author(s): KAI KUPFERSCHMIDT

Publication Date: 26 JAN 2018

Publication Site: Science

Current Causes of Death in Children and Adolescents in the United States

Link: https://www.nejm.org/doi/full/10.1056/NEJMc2201761

Graphic:

Excerpt:

In addition, drug overdose and poisoning increased by 83.6% from 2019 to 2020 among children and adolescents, becoming the third leading cause of death in that age group. This change is largely explained by the 110.6% increase in unintentional poisonings from 2019 to 2020. The rates for other leading causes of death have remained relatively stable since the previous analysis, which suggests that changes in mortality trends among children and adolescents during the early Covid-19 pandemic were specific to firearm-related injuries and drug poisoning; Covid-19 itself resulted in 0.2 deaths per 100,000 children and adolescents in 2020.1

Although the new data are consistent with other evidence that firearm violence has increased during the Covid-19 pandemic,5 the reasons for the increase are unclear, and it cannot be assumed that firearm-related mortality will later revert to prepandemic levels. Regardless, the increasing firearm-related mortality reflects a longer-term trend and shows that we continue to fail to protect our youth from a preventable cause of death. Generational investments are being made in the prevention of firearm violence, including new funding opportunities from the CDC and the National Institutes of Health, and funding for the prevention of community violence has been proposed in federal infrastructure legislation. This funding momentum must be maintained.

Author(s):

Jason E. Goldstick, Ph.D.
Rebecca M. Cunningham, M.D.
Patrick M. Carter, M.D.
University of Michigan, Ann Arbor, MI

Publication Date: 19 May 2022

Publication Site: New England Journal of Medicine

Firearm Mortality by State

Link: https://www.cdc.gov/nchs/pressroom/sosmap/firearm_mortality/firearm.htm

Graphic:

Excerpt:

1 The number of deaths per 100,000 total population.

Source: https://wonder.cdc.gov

States are categorized from highest rate to lowest rate. Although adjusted for differences in age-distribution and population size, rankings by state do not take into account other state specific population characteristics that may affect the level of mortality. When the number of deaths is small, rankings by state may be unreliable due to instability in death rates.

Publication Date: accessed 31 May 2022

Publication Site: CDC

Drug-Overdose Deaths Reached a Record in 2021, Fueled by Fentanyl

Link: https://www.wsj.com/articles/drug-overdose-deaths-reached-a-record-in-2021-fueled-by-fentanyl-11652277600

Graphic:

Excerpt:

Drug-overdose deaths in 2021 topped 100,000 for the first time in a calendar year, federal data showed, a record high fueled by the spread of illicit forms of fentanyl throughout the country.

More than 107,000 people in the U.S. died from drug overdoses last year, preliminary Centers for Disease Control and Prevention data released Wednesday showed, roughly a 15% increase from 2020. The proliferation of the potent synthetic opioid fentanyl has been compounded by the destabilizing effects of the Covid-19 pandemic on users and people in recovery, according to health authorities and treatment providers.

The U.S. has recorded more than one million overdose deaths since 2000, and more than half of those came in the past seven years.

….

The agency has counted about 103,600 overdoses for 2021 but believes the number is several thousand higher due to suspected overdoses that haven’t yet been confirmed by local death investigators, Dr. Anderson said.

Author(s): Jon Kamp

Publication Date: 11 May 2022

Publication Site: WSJ

Fact-check: Do ‘more people die from hands, fists, feet, than rifles’?

Link: https://www.yahoo.com/news/fact-check-more-people-die-120052963.html

Excerpt:

“More people die from hands, fists, feet, than rifles. Guess we should ban limbs now…,” reads the May 25 post. Underneath, a graphic titled “Number of murder victims in the Unites States in 2020 by weapon used” shows rifle deaths at 455 and deaths from “personal weapons (hands, fists, feet, etc.)” as 662. The post includes a link to a website called Statista.

….

FBI data from 2020 does show that more people died from injuries sustained from other people’s fists, feet and hands than from rifles. But there’s a little more you should know about that data before you use it to draw conclusions.

Author(s): Jeff Cercone of Austin American-Statesman

Publication Date: 30 May 2022

Publication Site: Yahoo News

A NHTSA official spent years trying to cut road deaths. They jumped last year.

Link: https://www.washingtonpost.com/transportation/2022/05/21/road-deaths-fatalities-safety/

Graphic:

Excerpt:

Before Jeffrey Michael spent three decades in the federal government trying toreduce the nation’s road fatalities, he worked in college as a car mechanic.

He took that love of cars to the National Highway Traffic Safety Administration, where he worked on seat belts, child restraints, drunken driving and emergency medical services, eventually overseeing behavioral research at the agency. At home in the Washington suburbs, he would tinker with the 1987 Porsche 911 he bought as a fixer-upper. After retiring in 2018, he joined the Johns Hopkins Center for Injury Research and Policy.

Michael saw the abilityof federal programs to influence safety and cites a gradual reduction in road deaths over 50 years. But in an interview with The Washington Post — daysafter new NHTSA figures showed fatalities hitting a 16-year high — Michael pointed to the nation’s failure and potential fixes.

Author(s): Michael Laris

Publication Date: 21 May 2022

Publication Site: Washington Post

14.9 million excess deaths associated with the COVID-19 pandemic in 2020 and 2021

Link: https://www.who.int/news/item/05-05-2022-14.9-million-excess-deaths-were-associated-with-the-covid-19-pandemic-in-2020-and-2021

Excerpt:

New estimates from the World Health Organization (WHO) show that the full death toll associated directly or indirectly with the COVID-19 pandemic (described as “excess mortality”) between 1 January 2020 and 31 December 2021 was approximately 14.9 million (range 13.3 million to 16.6 million).  

“These sobering data not only point to the impact of the pandemic but also to the need for all countries to invest in more resilient health systems that can sustain essential health services during crises, including stronger health information systems,” said Dr Tedros Adhanom Ghebreyesus, WHO Director-General. “WHO is committed to working with all countries to strengthen their health information systems to generate better data for better decisions and better outcomes.”

Excess mortality is calculated as the difference between the number of deaths that have occurred and the number that would be expected in the absence of the pandemic based on data from earlier years. 

Excess mortality includes deaths associated with COVID-19 directly (due to the disease) or indirectly (due to the pandemic’s impact on health systems and society). Deaths linked indirectly to COVID-19 are attributable to other health conditions for which people were unable to access prevention and treatment because health systems were overburdened by the pandemic. The estimated number of excess deaths can be influenced also by deaths averted during the pandemic due to lower risks of certain events, like motor-vehicle accidents or occupational injuries. 

Publication Date: 5 May 2022

Publication Site: WHO

Tracking covid-19 excess deaths across countries

Link: https://www.economist.com/graphic-detail/coronavirus-excess-deaths-tracker?utm_campaign=a.coronavirus-special-edition&utm_medium=email.internal-newsletter.np&utm_source=salesforce-marketing-cloud&utm_term=2022042&utm_content=ed-picks-article-link-5&etear=nl_special_5&utm_campaign=a.coronavirus-special-edition&utm_medium=email.internal-newsletter.np&utm_source=salesforce-marketing-cloud&utm_term=4/2/2022&utm_id=1119326

Graphic:

Excerpt:

As covid-19 has spread around the world, people have become grimly familiar with the death tolls that their governments publish each day. Unfortunately, the total number of fatalities caused by the pandemic may be even higher, for several reasons. First, the official statistics in many countries exclude victims who did not test positive for coronavirus before dying—which can be a substantial majority in places with little capacity for testing. Second, hospitals and civil registries may not process death certificates for several days, or even weeks, which creates lags in the data. And third, the pandemic has made it harder for doctors to treat other conditions and discouraged people from going to hospital, which may have indirectly caused an increase in fatalities from diseases other than covid-19.

One way to account for these methodological problems is to use a simpler measure, known as “excess deaths”: take the number of people who die from any cause in a given region and period, and then compare it with a historical baseline from recent years. We have used statistical models to create our baselines, by predicting the number of deaths each region would normally have recorded in 2020 and 2021.

Many Western countries, and some nations and regions elsewhere, regularly publish data on mortality from all causes. The table below shows that, in most places, the number of excess deaths (compared with our baseline) is greater than the number of covid-19 fatalities officially recorded by the government. The full data for each country, as well as our underlying code, can be downloaded from our GitHub repository. Our sources also include the Human Mortality Database, a collaboration between UC Berkeley and the Max Planck Institute in Germany, and the World Mortality Dataset, created by Ariel Karlinsky and Dmitry Kobak.

Publication Date: last updated 13 May 2022

Publication Site: The Economist

COVID-19 Mortality Study: Analytics – 2021 Q2

Link: https://www.limra.com/en/research/benchmarks/u.s.-individual-life-insurance-covid-19-mortality-experience-study/analytics/2021-q2/

Graphic:

Excerpt:

LIMRA, Reinsurance Group of America (RGA), the Society of Actuaries (SOA) Research Institute, and TAI have collaborated on an ongoing effort to analyze the impact of COVID-19 on the
individual life insurance industry’s mortality experience and share the emerging results with the insurance industry and the public. The Individual Life COVID-19 Project Work Group (Work
Group) was formed as a collaboration of LIMRA, RGA, the SOA Research Institute, and TAI to design, implement, and create the study and to produce and distribute a variety of analyses.
This report is the fifth public release from this collaboration and contains the results of the study of excess mortality for individual life insurance to include the second quarter of 2021.
Data from 31 companies representing approximately 72% of the industry face amount in force have been included in the analysis in this report. A total of 3.0 million death claims from
individual life policies from 2015 through June 30, 2021 make up the basis of the analysis.


Highlights for the 2nd Quarter

  • The second quarter of 2021 showed a significant realignment of the actual to expected relative mortality ratios, across many different cuts of the data.
  • It is worth noting that the third quarter 2021 results will likely not be as favorable due to the impact of the COVID-19 Delta variant whose impact first started in July 2021 and peaked
    around mid- September
  • All age groups improved in the second quarter compared to the first quarter of 2021, but the improvement was more dramatic in the older ages. While the three age groups shown under
    age 65 were still significantly over the trend established by 2015-2019, the age 65-84 group was within the 95% confidence bands and the age 85+ group was significantly better than the
    2015-2019 trend (p < 0.05).
  • Whereas the pandemic experience so far had showed substantial variations across different regions, this appears to have moderated during the 2nd quarter of 2022.

Author(s): Individual Life COVID-19 Project Work Group, SOA

Publication Date: May 2022, accessed 21 May 2022

Publication Site: LIMRA