U.S. Individual Life COVID-19 Reported Claims Analysis, Fourth Quarter, 2021 Update

Link: https://www.soa.org/resources/experience-studies/2022/us-ind-life-covid-q4/

PDF: https://www.soa.org/49ab0d/globalassets/assets/files/resources/research-report/2022/us-ind-life-covid-q4.pdf

Graphic:

Description:

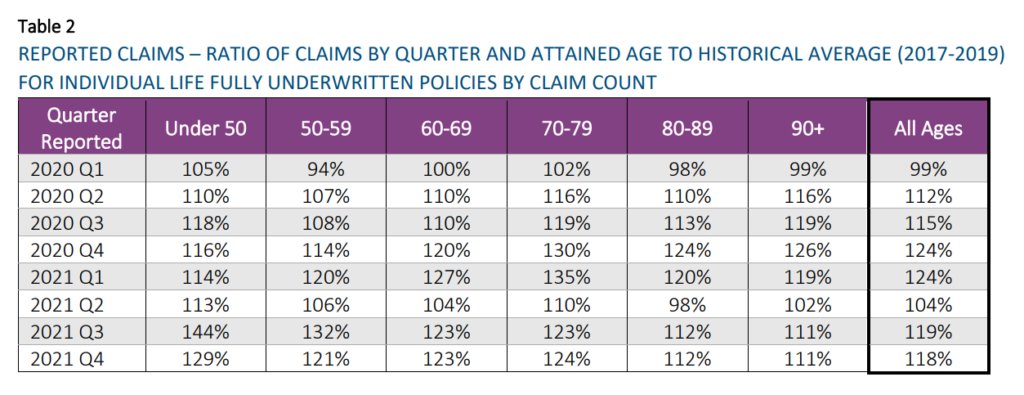
LIMRA, Reinsurance Group of America (RGA), the Society of Actuaries Research Institute (SOA), and TAI have collaborated on an ongoing effort to analyze the impact of COVID-19 on the individual life insurance industry’s mortality experience and share the emerging results with the insurance industry and the public. This report documents a high-level analysis of the claims that have been reported through December 31, 2021. The results presented here are based on data from 32 companies representing approximately 72% of the individual life insurance in force for the experience period of the study.

Author(s): Individual Life COVID-19 Project Work Group

Publication Date: May 2022, accessed 21 May 2022

Publication Site: Society of Actuaries

U.S. Life Insurance Sales Rise on Covid-19 Fears

Link: https://www.wsj.com/articles/u-s-life-insurance-sales-spike-on-covid-19-fears-11647347494

Graphic:

Excerpt:

Americans went on a buying spree for life insurance in 2021, driven by concerns of death from the coronavirus pandemic.

Premium volume for new individual life-insurance policies surged 20% from 2020, while the number of policies issued rose 5%, the biggest year-over-year percentage gains since the 1980s, according to industry-funded research firm Limra.

“As we zero in on one million Americans who tragically lost their lives, it’s not a surprise that people are thinking about their own mortality and the impact on loved ones if anything were to happen to them,” said David Levenson, Limra’s chief executive.

The exact number of policies sold is still being calculated, but it is expected to top 10 million, Limra said. That milestone was last crossed in 2016. In 2020, an estimated 9.83 million policies were sold, up 1.7% from 2019.

Author(s): Leslie Scism

Publication Date: 15 March 2022

Publication Site: WSJ

Life Application Activity Cools Again

Link: https://www.thinkadvisor.com/2022/05/10/life-application-activity-cools-again/

Excerpt:

Policygenius, a life insurance web broker, uses its term life pricing information to provide monthly term life price index reports.

The company bases the index on prices for coverage with a 20-year-level premium term.

The lowest price shown is for coverage for a 25-year-old female nonsmoker who wants $250,000 in death benefits; The highest price is for a 55-year-old male smoker who wants $1 million in death benefits.

Policygenius figures suggest rising premiums may not be causing life application friction.

This month, the lowest price in the tables fell slightly, to $14.21, from $14.25 last month.

Author(s): Allison Bell

Publication Date: 10 May 2022

Publication Site: Think Advisor

Rise in Non-Covid-19 Deaths Hits Life Insurers

Link: https://www.wsj.com/articles/rise-in-non-covid-19-deaths-hits-life-insurers-11645576252

Graphic:

Excerpt:

U.S. life insurers, as expected, made a large number of Covid-19 death-benefit payouts last year. More surprisingly, many saw a jump in other death claims, too.

Industry executives and actuaries believe many of these other fatalities are tied to delays in medical care as a result of lockdowns in 2020, and then, later, people’s fears of seeking out treatment and trouble lining up appointments.

…..

Primerica executives similarly cautioned in their fourth-quarter call about outsize numbers of non-Covid-19 deaths in 2022. “Some of these will be the result of delayed medical care or the increased incidence of societal-related issues, such as the increased prevalence of substance abuse,” Chief Financial Officer Alison Rand said in an email interview.

From early stages of the pandemic, many medical professionals have raised concerns about Americans’ untreated health problems, as Covid-19 put stress on the nation’s healthcare system.

Trade group American Council of Life Insurers said the pandemic in 2020 drove the biggest annual increase in death benefits paid by U.S. carriers since the 1918 influenza epidemic, totaling billions of dollars. The hit to the industry’s bottom line has been less than initially feared, however, because many victims have been older people who typically have smaller policies, if any coverage.

Still, Covid-19 and other excess deaths have cut into many carriers’ quarterly earnings, especially as deaths linked to the Delta variant increased for people in their working years with employer-sponsored death benefits. “Earnings impacts have been material and there still appears to be some Covid-19 discount, but investors are starting to look through mortality claims costs,” said Andrew Kligerman, a stock analyst with Credit Suisse Securities.

Author(s): Leslie Scism

Publication Date: 23 Feb 2022

Publication Site: WSJ

COVID-19 Deaths Cause More Than $700M in Q1 Claims

Link: https://www.thinkadvisor.com/2022/05/09/covid-19-deaths-continue-to-hit-life-insurers-hard/

Excerpt:

COVID-19 returned to killing older Americans at a much higher rate than younger Americans in the first quarter, and that helped to hold down life insurers’ death claims.

The pandemic killed about 155,000 U.S. residents in the latest quarter. That was up from 127,000 in the fourth quarter of 2021, but down from 191,000 in the first quarter of 2021, according to statistics from the U.S. Centers for Disease Control and Prevention and other public and private sources.

Some life insurers and reinsurers that posted earnings last week skipped COVID-19 mortality details.

…..

MetLife: $230 million in world group life claims this quarter, down from $280 million a year earlier.

Hartford Financial: $96 million before taxes this quarter, down from $185 million a year earlier.

Unum: 1,400 deaths at an average of $55,000, or $77 million, down from 1,725 deaths at an average of $65,000, or $112 million, a year earlier.

Lincoln Financial: $53 million in group life claim claims and $18 million in group disability claims this quarter, down from $83 million in group life claims and $7 million in group disability claims a year earlier.

Voya: $35 million in group life claims this quarter, up from $29 million a year earlier.

Author(s): Allison Bell

Publication Date: 9 May 2022

Publication Site: Think Advisor

MetLife’s Earnings Surge, but Covid-19 Limits Insurer’s Latest Results

Link: https://www.wsj.com/articles/metlifes-earnings-surge-but-covid-19-limits-insurers-latest-results-11643844316

Excerpt:

High levels of Covid-19 deaths hurt fourth-quarter results in MetLife Inc.’s business of providing employer-sponsored life insurance as the Delta variant persisted in the U.S., but the outsize payouts were more than offset by unusually strong investment gains.

The New York company’s net income soared to $1.18 billion, compared with a year-earlier period that had been hurt by mark-to-market losses on financial hedges that aim to protect against falling interest rates. MetLife’s adjusted earnings, which analysts track as a measure of recurring profitability, were flat at $1.84 billion.

Another household-name insurer, Allstate Corp., reported a 70% drop in net income to $790 million, and a 50% decline in adjusted net income to $796 million, primarily driven by worsened car-insurance underwriting income. Accident volume increased on more-crowded roads, and inflation pushed repair costs higher.

Catastrophe costs were also higher. U.S. property insurers ended the year with two high-profile catastrophes: deadly tornadoes in and around Kentucky, and devastating wildfire between Denver and Boulder, Colo.

Author(s): Leslie Scism

Publication Date: 2 Feb 2022

Publication Site: WSJ

Are Seat Belts Making You Less Safe?

Link: https://fee.org/articles/are-seat-belts-making-you-less-safe/

Excerpt:

In the 1960s, the federal government—in its infinite wisdom—thought that cars were too unsafe for the general public. In response, it passed automobile safety legislation, requiring that seat belts, padded dashboards, and other safety measures be put in every automobile.

Although well-intended, auto accidents actually increased after the legislation was passed and enforced. Why? As Lansburg explains, “the threat of being killed in an accident is a powerful incentive to drive carefully.”

In other words, the high price (certain death from an accident) of an activity (reckless driving) reduced the likelihood of that activity. The safety features reduced the price of reckless driving by making cars safer. For example, seatbelts reduced the likelihood of a driver being hurt if he drove recklessly and got into an accident. Because of this, drivers were more likely to drive recklessly.

The benefit of the policy was that it reduced the number of deaths per accident. The cost of the policy was that it increased the number of accidents, thus canceling the benefit. Or at least, that is the conclusion of University of Chicago’s Sam Peltzman, who found the two effects canceled each other.

His work has led to a theory called “The Peltzman Effect,” also known as risk compensation. Risk compensation says that safety requirements incentivize people to increase risky behavior in response to the lower price of that behavior.

Author(s): Joshua Anumolu

Publication Date: 13 July 2017

Publication Site: FEE

Seat Belt Usage and Risk Taking in Driving Behavior

Link: https://www.jstor.org/stable/44633774

Graphic:

Abstract:

This study tested the hypothesis that seat belt usage is related to driver risk taking in car-following behavior. Individual vehicles on a Detroit area freeway were monitored to identify seat belt users and nonusers. Headways between successive vehicles in the traffic stream were also measured to provide a behavioral indicator of driver risk taking. Results showed that nonusers of seat belts tended to follow other vehicles closer than did users. Users were also less likely than nonusers to follow other vehicles at very short headways (one second or less). The implications of these findings for occupant safety in rear end collisions are discussed.

Author(s): Buseck, Calvin R. von, Leonard Evans, Donald E. Schmidt, and Paul Wasielewski

Publication Date: 1980

Publication Site: jstor, originally published in SAE Transactions, vol 89

Cite:

von Buseck, Calvin R., et al. “Seat Belt Usage and Risk Taking in Driving Behavior.” SAE Transactions, vol. 89, 1980, pp. 1529–33. JSTOR, http://www.jstor.org/stable/44633774. Accessed 21 May 2022.

Why driving needs to feel less safe

Link: https://ctmirror.org/2022/04/18/why-driving-needs-to-feel-less-safe/

Excerpt:

Motor vehicle fatalities in Connecticut have risen dramatically since the pandemic, echoing a trend that we’ve seen across the country. About 300 people are killed annually on Connecticut’s streets by motor vehicles, and about 100 times as many people (roughly 30,000) suffer injuries severe ePnough to warrant hospital admission.

Nationally, these figures are roughly 40,000 deaths and 3.4 million injuries per year. The U.S. is an outlier among developed countries in the number  of deaths that we tolerate on our roads, with a death rate 2 to 3 times that of similarly wealthy countries. The human cost of this carnage leaves no one untouched: almost everyone knows at least one person killed by a vehicle, not to mention millions of others who suffer from life-altering consequences like paralysis and traumatic brain injuries.

If we truly care about saving lives and preventing injuries, we need to change the mindset by which we view the act of driving.

Author(s): Dice Oh

Publication Date: 18 April 2022

Publication Site: CT Mirror

Covid-19’s full death toll is nearly three times higher than reported, WHO data suggests

Link: https://www.cnn.com/2022/05/05/health/covid-excess-mortality-who-data/index.html

Excerpt:

About 14.9 million people around the world died as a direct or indirect result of Covid-19 in the period between January 1, 2020, and December 31, 2021, according to new estimates from the World Health Organization — nearly three times more deaths than were officially reported.

There were 5.4 million Covid-19 deaths reported to WHO during that timeframe, resulting in an excess mortality estimate of 9.5 million more deaths than what was reported.

“Excess mortality is the difference between the number of deaths that have been recorded and those that would be expected in the absence of the pandemic,” said Samira Asma, assistant director-general for the Data, Analytics and Delivery for Impact Division of WHO.

Author(s): Carma Hassan

Publication Date: 6 May 2022

Publication Site: CNN

Achievements in Public Health, 1900-1999: Healthier Mothers and Babies

Link: https://www.cdc.gov/mmwr/preview/mmwrhtml/mm4838a2.htm

Graphic:

Excerpt:

Despite the dramatic decline in infant and maternal mortality during the 20th century, challenges remain. Perhaps the greatest is the persistent difference in maternal and infant health among various racial/ethnic groups, particularly between black and white women and infants. Although overall rates have plummeted, black infants are more than twice as likely to die as white infants; this ratio has increased in recent decades. The higher risk for infant mortality among blacks compared with whites is attributed to higher LBW incidence and preterm births and to a higher risk for death among normal birthweight infants (greater than or equal to 5 lbs, 8 oz [greater than or equal to 2500 g]) (18). American Indian/ Alaska Native infants have higher death rates than white infants because of higher SIDS rates. Hispanics of Puerto Rican origin have higher death rates than white infants because of higher LBW rates (19). The gap in maternal mortality between black and white women has increased since the early 1900s. During the first decades of the 20th century, black women were twice as likely to die of pregnancy-related complications as white women. Today, black women are more than three times as likely to die as white women.

During the last few decades, the key reason for the decline in neonatal mortality has been the improved rates of survival among LBW babies, not the reduction in the incidence of LBW. The long-term effects of LBW include neurologic disorders, learning disabilities, and delayed development (20). During the 1990s, the increased use of assisted reproductive technology has led to an increase in multiple gestations and a concomitant increase in the preterm delivery and LBW rates (21). Therefore, in the coming decades, public health programs will need to address the two leading causes of infant mortality: deaths related to LBW and preterm births and congenital anomalies. Additional substantial decline in neonatal mortality will require effective strategies to reduce LBW and preterm births. This will be especially important in reducing racial/ethnic disparities in the health of infants.

Approximately half of all pregnancies in the United States are unintended, including approximately three quarters among women aged less than 20 years. Unintended pregnancy is associated with increased morbidity and mortality for the mother and infant. Lifestyle factors (e.g., smoking, drinking alcohol, unsafe sex practices, and poor nutrition) and inadequate intake of foods containing folic acid pose serious health hazards to the mother and fetus and are more common among women with unintended pregnancies. In addition, one fifth of all pregnant women and approximately half of women with unintended pregnancies do not start prenatal care during the first trimester. Effective strategies to reduce unintended pregnancy, to eliminate exposure to unhealthy lifestyle factors, and to ensure that all women begin prenatal care early are important challenges for the next century.

Author(s): Division of Reproductive Health, National Center for Chronic Disease Prevention and Health Promotion, CDC.

Publication Date: 1 October 1999

Publication Site: CDC MMWR

Year 2000 Standard Million Population for the United States — Age-Adjusted Rates

Link: https://wonder.cdc.gov/wonder/help/ucd.html#Age-Adjusted%20Rates

Graphic:

Excerpt:

Age-Adjusted Rates

Age-adjusted death rates are weighted averages of the age-specific death rates, where the weights represent a fixed population by age. They are used to compare relative mortality risk among groups and over time. An age-adjusted rate represents the rate that would have existed had the age-specific rates of the particular year prevailed in a population whose age distribution was the same as that of the fixed population. Age-adjusted rates should be viewed as relative indexes rather than as direct or actual measures of mortality risk.

The year “2000 U.S. standard” is the default population selection for the calculation of age-adjusted rates. However, you can select other standard populations, or select specific population criteria to determine the age distribution ratios. See Frequently Asked Questions about Death Rates for more information.

The rates of almost all causes of death vary by age. Age adjustment is a technique for “removing” the effects of age from crude rates, so as to allow meaningful comparisons across populations with different underlying age structures. For example, comparing the crude rate of heart disease in Florida to that of California is misleading, because the relatively older population in Florida will lead to a higher crude death rate, even if the age-specific rates of heart disease in Florida and California are the same. For such a comparison, age-adjusted rates are preferable. Age-adjusted rates should be viewed as relative indexes rather than as direct or actual measures of mortality risk.

The National Center for Health Statistics (NCHS) age-adjusts death rates using the direct method. That is, by applying age-specific death rates (Ri) to the U.S. standard population age distribution.

R’ = S i ( Psi / Ps ) R i

where Psi is the standard population for age group i and Ps is the total U.S. standard population (all ages combined).

In the direct method, a standard age distribution is chosen and the age-specific death rates are weighted according to the standard. A reasonable choice for the standard is the U.S. total population (all races, both genders) for the year under study. To permit comparison of death rates from year to year, a standard population is used. Beginning with the 1999 data year, NCHS adopted the year 2000 projected population of the United States as the standard population. This new standard replaces the 1940 standard population that was used by NCHS for over 50 years. The new population standard affects the level of mortality and to some extent trends and group comparisons. Of particular note are the effects on race comparison of mortality. For detailed discussion, see:Anderson RN, Rosenberg HM. Age standardization of death rates: Implementation of the year 2000 standard. National Vital Statistics Reports; vol 47 no 3. Hyattsville, Maryland. National Center for Health Statistics. 1998.Beginning with publications of the year 2003 data, the traditional standard million population along with corresponding standard weights to six decimal places were replaced by the projected year 2000 population age distribution (see 2000 Standard Population below). The effect of the change is negligible and does not significantly affect comparability with age-adjusted rates calculated using the previous method.

Publication Date: Accessed 21 May 2022, last reviewed 2 March 2022

Publication Site: CDC WONDER