Link: https://www.politico.com/news/magazine/2022/04/22/nebraska-covid-response-pete-ricketts-00026993
Graphic:
Excerpt:
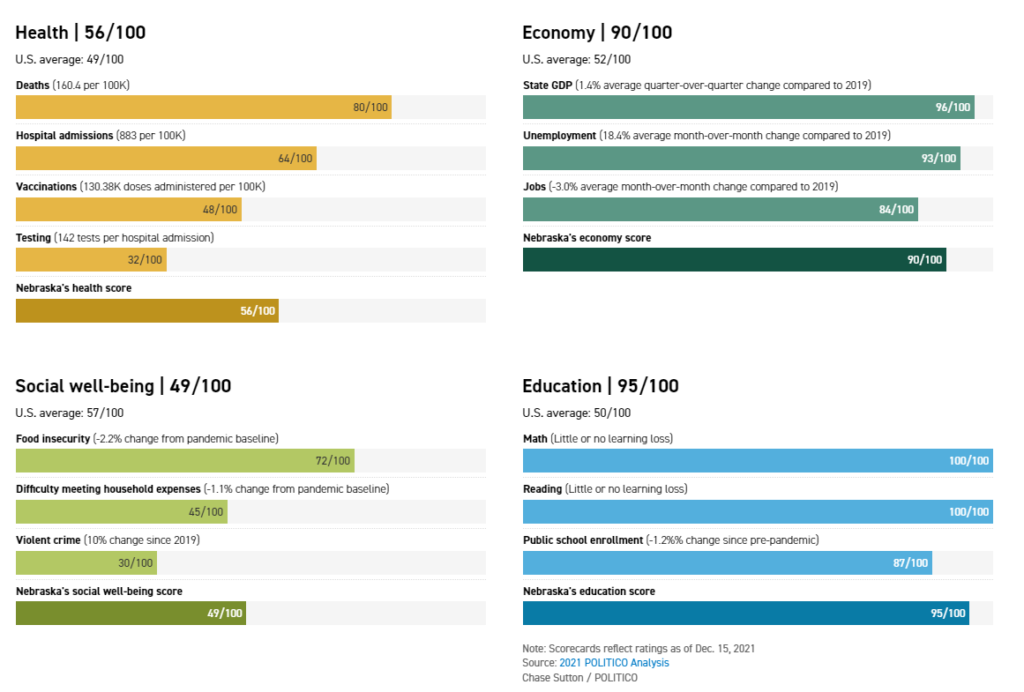
This conversation about protecting hospitals, back in the era when New Yorkers were still being encouraged to go to restaurants, well before the coasts’ contagion began closing in on the Midwest in earnest, helped define what became, by some measures, one of the most effective and balanced Covid responses in the United States. Ricketts is a mandate-shunning Republican who runs a heavily Republican and rural state with a middling vaccination rate — factors that have been linked to worse pandemic health outcomes in other states. He never ordered a statewide shutdown when 43 other governors, Democrats and Republicans, did so; he has stood against, or even supported lawsuits over, local mask requirements; he has told state agencies not to comply with federal vaccine mandates and gotten scolded by the U.S. secretary of defense for objecting to such requirements for the National Guard. And yet by the fall of last year, when POLITICO crunched the data of state pandemic responses on a combination of health, economic, social and educational factors, one state came out with the best average: Nebraska.
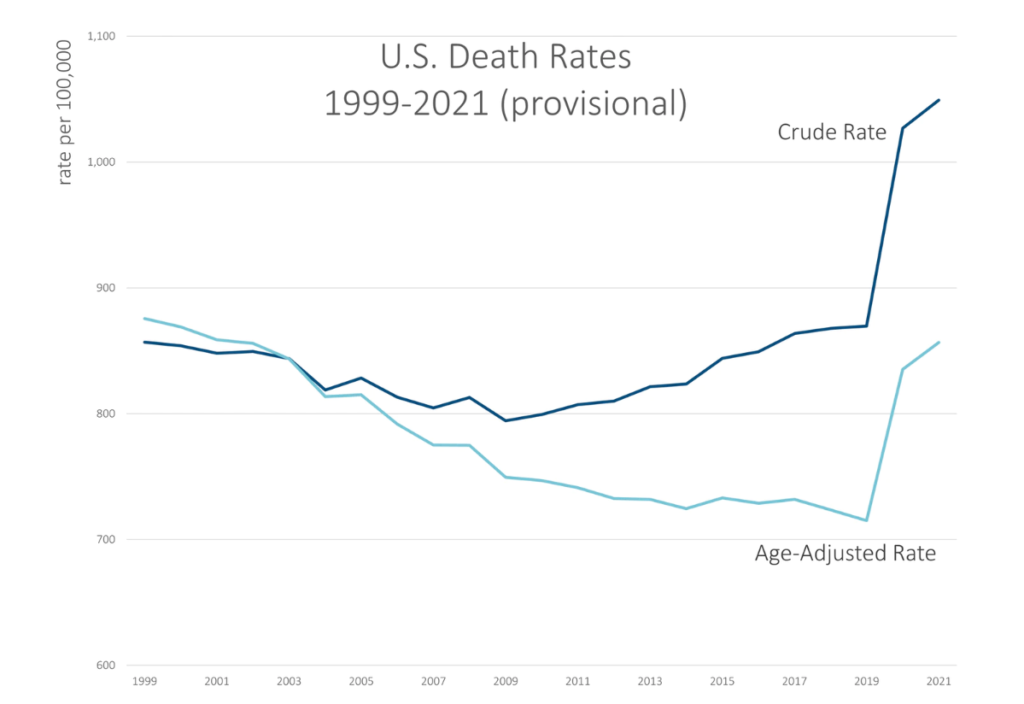
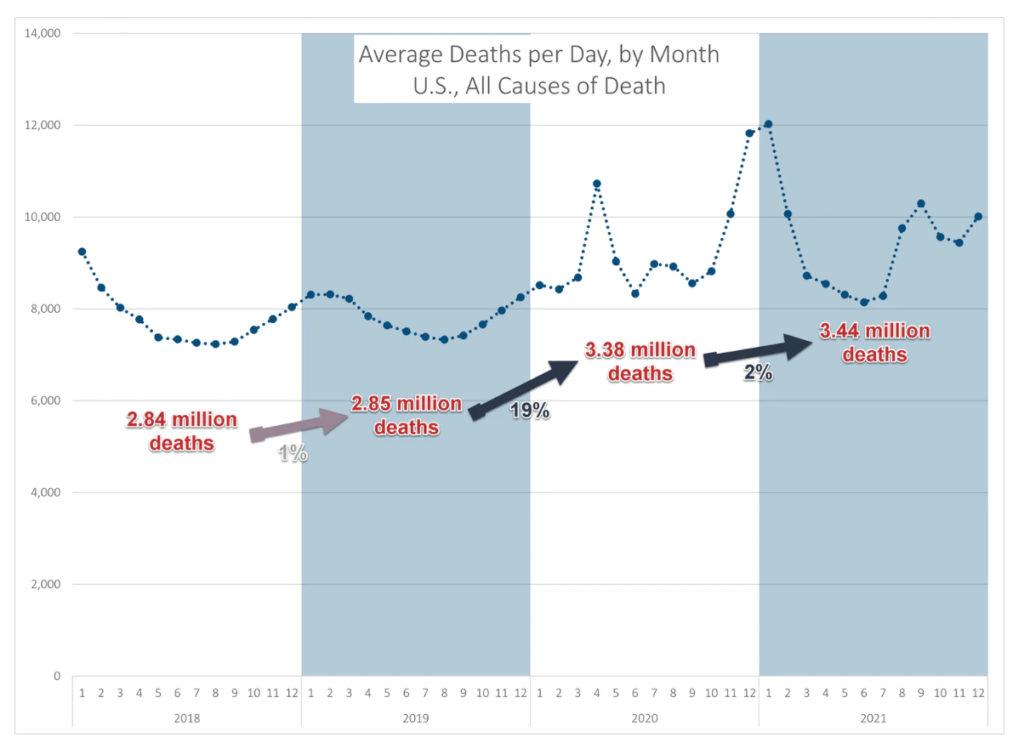
The state had the best economic performance of any in the pandemic up to that point, and its students, according to available data, appear to have suffered little to no learning loss. Whereas many states saw a trade-off between health and wealth in the pandemic — often corresponding to more-restrictive Democratic leadership and less-restrictive Republican leadership, respectively — Nebraska also scored above the national average for health outcomes POLITICO evaluated last year (20th of 50 states). Nebraska was the first state to accumulate a 120-day stockpile of PPE in the nationwide scramble for supplies; was a national leader in opening schools; and was among the quickest getting federal aid to small businesses. As of now, its cumulative pandemic death toll per capita is near the lowest of all 50 states, according to the Kaiser Family Foundation. This, however, is grading on a hideous curve in a country that hasn’t managed the pandemic well in general: More than 4,000 Nebraskans have lost their lives to Covid. Lawler of the University of Nebraska Medical Center, who helped design the state’s early Covid response but has since grown critical of Nebraska’s approach, notes that South Korea has 14 times lower per capita Covid mortality than Nebraska. “Nobody,” he told me via text, “should be patting themselves on the back for doing 14 [times] worse.”
Author(s): Kathy Gilsinan
Publication Date: 22 April 2022
Publication Site: Politico