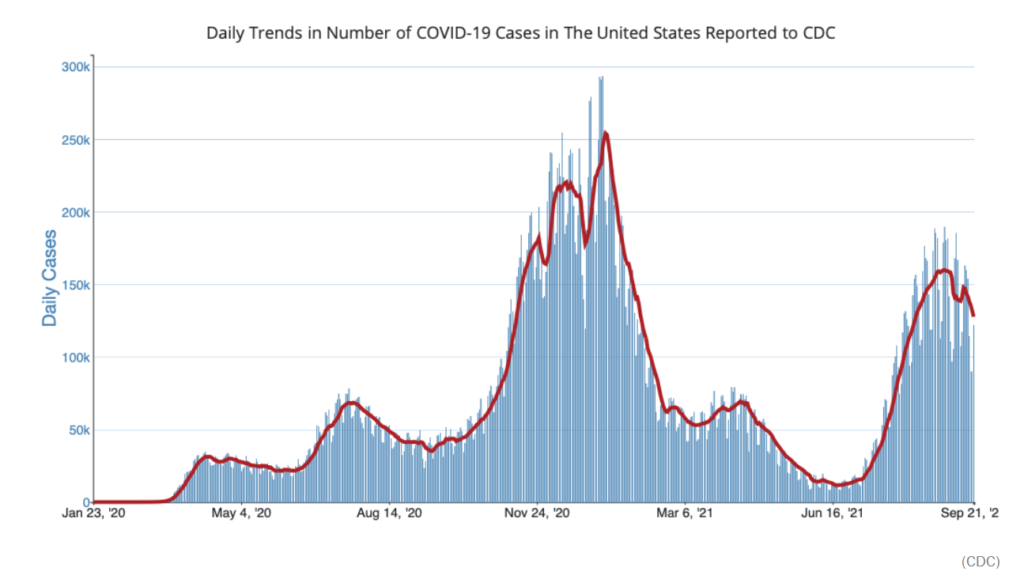
Will COVID-19 cases and deaths surge again this winter? The combined just-released results of 9 models applied to four different scenarios at COVID-19 Modeling Hub project that diagnosed cases could—using the projections of the more hopeful models—drop to around 9,000 cases per day by March. The scenarios range from the most hopeful, with childhood COVID-19 vaccinations and no new viral variant, to one with no child vaccinations and a new variant.
……
University of North Carolina epidemiologist Justin Lessler, who helps run the hub, tells NPR that the most likely scenario is that children do get vaccinated and no super-spreading variant emerges.
The good news is that about 55 percent of all Americans (181 million) are now fully vaccinated (64 percent of those age 12 and up). Given that unreported COVID-19 cases are generally thought to be considerably higher than the 42 million diagnosed cases, that suggests perhaps around 100 million Americans have developed natural immunity to the virus.
Moshe Milevsky claims that someone could be up to 20 years younger biologically than their chronological age, and that biological age is a much be a better way of determining a person’s longevity. If this is true, is there a way that organizations that specialize in longevity and/or mortality and that use mathematical calculations in order to determine risk could use biological age instead of chronological age to predict future health and longevity?
…..
There are two methods used to calculate biological age, coined by Milevsky as the “living” methodology or the “dying” methodology a.k.a. the mortality-adjusted approach.
Both methods begin with the collection of data. A researcher would first gather data from a large group of people at a wide range of ages, collecting biological samples and measurements in order to record various physiological and molecular variables (such as heart rate, blood pressure, mutations of DNA, or the presence of certain proteins in the blood). Researchers may also collect data on variables that they believe will be correlated with enhancement or deterioration of a person’s physiological condition, such as their wealth, occupation or even their appearance or number of Facebook friends!
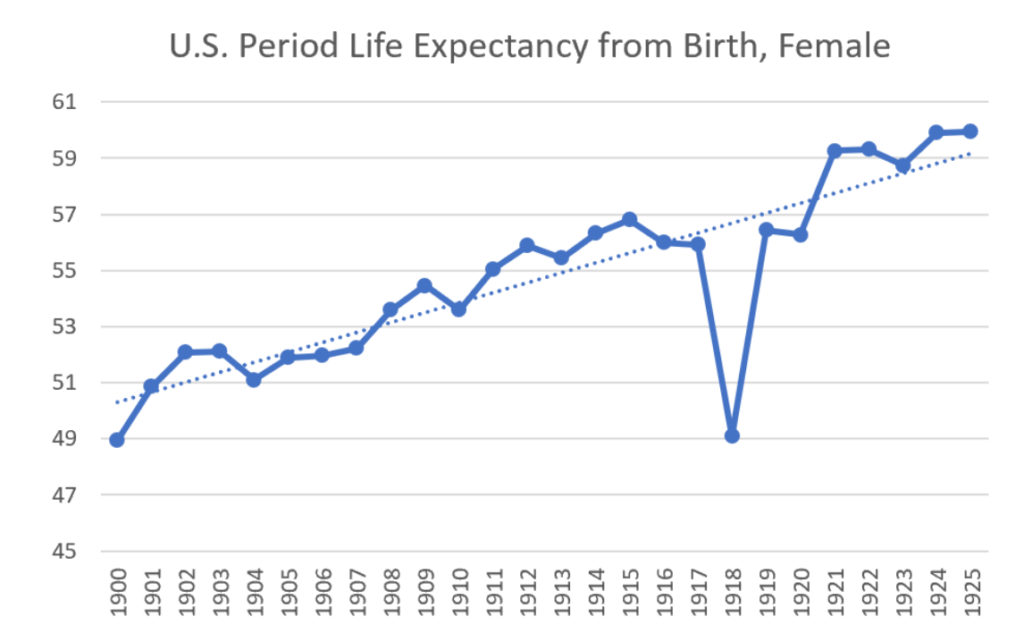
So, period life expectancy dropped about 12 – 13% in 1918 in the U.S., mainly due to the Spanish flu, because there was an outsized effect from young adults being the main group killed by the disease (also, period life expectancy was relatively short — under 60 years!). That was a drop of about 7 years.
But life expectancy dropped only about 1 year in 2020 due to COVID impacts, and that was a decrease of less than 3% compared to 2019.
So if you want to compare the effect of the Spanish flu vs. COVID-19 on the U.S. population, all of these rates —- percentage change in period life expectancy, age-adjusted death rates, or even crude death rate — are all more reasonable choices than simply number of people who died.
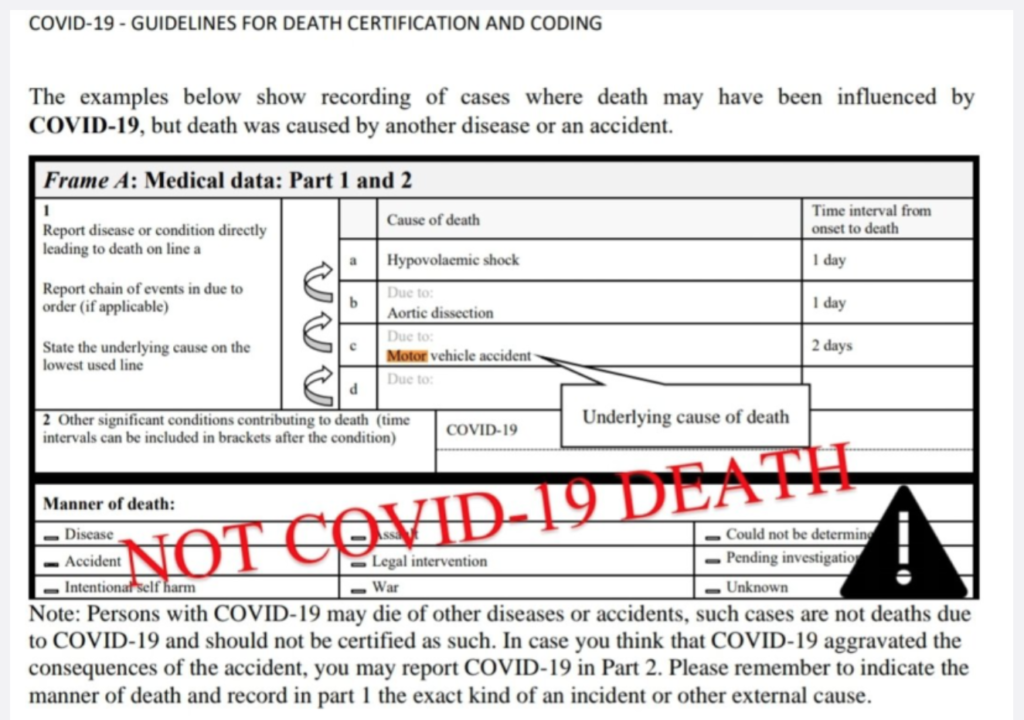
We had the opportunity to review death certificates for some of Florida’s recent COVID-19 deaths, and we can tell you definitively that Florida is counting deaths that were not directly caused by COVID-19.
Public health agencies have a goal of tracking the spread of a reportable disease, and for that reason, guidance was issued in March that any person who tested positive for COVID-19 should be counted as a COVID-19 death. However, the death count is now prominently featured in newscasts and used as a talking point to claim that some governments aren’t “doing enough” to stop the spread of COVID-19. COVID-19 metrics, including the number of reported deaths, are increasingly cited by governments as a reason to write public health recommendations into law.
……
A change in CDC guidance published on March 24, 2020 (COVID-19 Alert No.2) encouraged doctors to include COVID-19 in PART 1 “for all decedents where the disease caused or is assumed to have caused or contributed to death.” This was reinforced on April 5 (COVID-19 2020 Interim Case Definition), when the CDC said any death with COVID-19 on the death certificate is counted as a COVID-19 death, even if it was just presumed and had no confirming laboratory or clinical validation. In other words, the CDC guidance explicitly does not distinguish between deaths from COVID-19 and deaths withCOVID-19.
This is contrary to World Health Organization (WHO) guidelines, which say to count only deaths “resulting from a clinically compatible illness, in a probable or confirmed COVID-19 case, unless there is a clear alternative cause of death that cannot be related to COVID disease (e.g. trauma). There should be no period of complete recovery from COVID-19 between illness and death. A death due to COVID-19 may not be attributed to another disease (e.g. cancer).”
The U.S. on Monday crossed the threshold of 675,000 reported Covid-19 deaths, according to Johns Hopkins University, which tracks data from state health authorities. The Centers for Disease Control and Prevention estimates the influenza pandemic killed about that many people in the U.S. a century ago, in 1918 and 1919. Both figures are likely undercounts, epidemiologists and historians say.
There are several differences between the current pandemic and the one that claimed nearly as many lives more than 100 years ago. The U.S. at that time was roughly one-third its current size, so the flu pandemic took a proportionately bigger toll on the population. That pandemic had a devastating effect on young people, including small children and young-to-middle-aged adults, while Covid-19 has hit older people hardest, according to health officials.
Logging and landscaping are the most dangerous jobs in America, a new study finds.
The risk of death for loggers is more than 30 times higher than for all U.S. workers. Tree care workers also encounter hazards at rates far higher than a typical worker.
….
For the study, the researchers combed a U.S. Occupational Safety and Health Administration database for deaths from tree felling between 2010 and the first half of 2020.
Over the period, Michael’s team found 314 deaths. The leading cause of fatal accidents was being struck by a tree, most often in the head.
….
Years such as 2012, 2017 and 2018 with abnormally high damage from Atlantic storms saw high numbers of landscaping deaths that might be tied to storm damage, while 2014 and 2015 had quiet hurricane seasons and few deaths.
As new data shows 1 in 500 Americans has died from COVID-19 and the delta variant continues to surge across the country, the next challenge many health care leaders face is within their own staffs: the 27% of of U.S. health care workers who have not been vaccinated against the disease as of July, according to a study by The COVID States Project.
On top of that, other research shows that since the vaccine first became available to health care workers in December 2020, the rate of vaccination among nurses and nursing home aides has been lower than that of physicians. This may be of particular concern because nurses and aides have such frequent and close contact with patients.
Data shows health care workers have gotten the COVID-19 vaccine at a higher rate than the general population: 73% versus 64% of non-health care workers. And many may assume that people who work in health care industry are more enthusiastic about the vaccine and less apprehensive.
….
While a majority of nurses are vaccinated and more than half support vaccine mandates in the workplace, some are pushing back against requirements to get vaccinated or face mandatory testing and say they would rather leave their jobs. And hospitals are already feeling the effects.
As many as two of every five Americans who’ve died from COVID-19 were suffering from diabetes, making the chronic disease one of the highest-risk conditions during the pandemic, an expert says.
About 40% of deaths from COVID-19 in the United States were among diabetics, a “really quite sobering” statistic that should prompt people with the ailment to get vaccinated, said Dr. Robert Gabbay, chief scientific and medical officer for the American Diabetes Association.
…..
That diabetes was implicated in up to 40% of COVID-19 deaths is particularly staggering if you consider only 10% of the U.S. population suffers from the condition.
A look at the pattern of weekly deaths, all causes, for the entire United States through the beginning of September 2021, as well as: California Texas New York (minus NYC) New York City Pennsylvania Illinois CDC excess mortality dashboard: https://www.cdc.gov/nchs/nvss/vsrr/co…
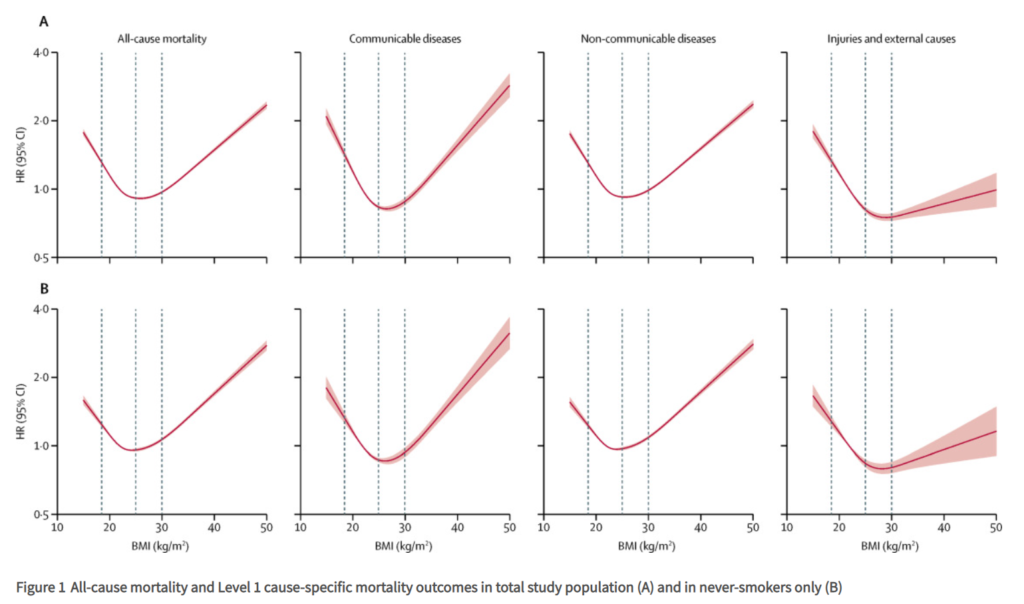
3 632 674 people were included in the full study population; the following results are from the analysis of never-smokers, which comprised 1 969 648 people and 188 057 deaths. BMI had a J-shaped association with overall mortality; the estimated hazard ratio per 5 kg/m2 increase in BMI was 0·81 (95% CI 0·80–0·82) below 25 kg/m2 and 1·21 (1·20–1·22) above this point. BMI was associated with all cause of death categories except for transport-related accidents, but the shape of the association varied. Most causes, including cancer, cardiovascular diseases, and respiratory diseases, had a J-shaped association with BMI, with lowest risk occurring in the range 21–25 kg/m2. For mental and behavioural, neurological, and accidental (non-transport-related) causes, BMI was inversely associated with mortality up to 24–27 kg/m2, with little association at higher BMIs; for deaths from self-harm or interpersonal violence, an inverse linear association was observed. Associations between BMI and mortality were stronger at younger ages than at older ages, and the BMI associated with lowest mortality risk was higher in older individuals than in younger individuals. Compared with individuals of healthy weight (BMI 18·5–24·9 kg/m2), life expectancy from age 40 years was 4·2 years shorter in obese (BMI ≥30·0 kg/m2) men and 3·5 years shorter in obese women, and 4·3 years shorter in underweight (BMI <18·5 kg/m2) men and 4·5 years shorter in underweight women. When smokers were included in analyses, results for most causes of death were broadly similar, although marginally stronger associations were seen among people with lower BMI, suggesting slight residual confounding by smoking.
Author(s):
Krishnan Bhaskaran, PhD Prof Isabel dos-Santos-Silva, PhD Prof David A Leon, PhD Ian J Douglas, PhD Prof Liam Smeeth, PhD
Averaged weekly, age-standardized rates (events per 100,000 persons) were higher among persons not fully vaccinated than among fully vaccinated persons for reported cases (112.3 versus 10.1), hospitalizations (9.1 versus 0.7), and deaths (1.6 versus 0.1) during April 4–June 19, as well as during June 20–July 17 (89.1 versus 19.4; 7.0 versus 0.7; 1.1 versus 0.1, respectively). Higher hospitalization and death rates were observed in older age groups, regardless of vaccination status, resulting in a larger impact of age-standardization on overall incidence for these outcomes.
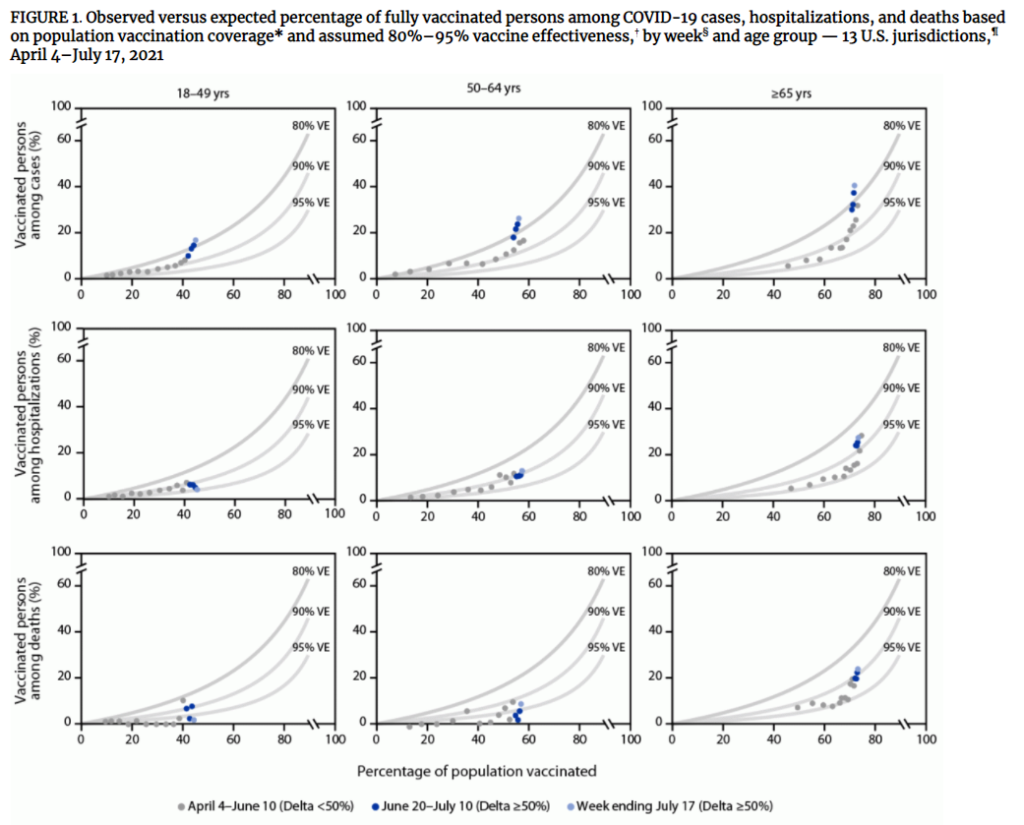
Within each age group, the percentage of vaccinated persons among cases, hospitalizations, and deaths increased with increasing vaccination coverage (Figure 1). As the prevalence of SARS-CoV-2 Delta variant surpassed 50%, the percentage of vaccinated persons among cases in each age group increased at rates corresponding to benchmarks for lower VE (i.e., from approximately 90% to <80%). Increases in the percentages of vaccinated persons aged ≥65 years among COVID-19–associated hospitalizations and deaths also appeared higher than expected. During June 20–July 17, age-standardized rates of cases, hospitalizations, and deaths among persons not fully vaccinated increased weekly; among fully vaccinated persons, case rates increased, but rates of hospitalizations and deaths remained largely unchanged (Figure 2).
Author(s): Heather M. Scobie, PhD1; Amelia G. Johnson, DrPH1; Amitabh B. Suthar, PharmD2; Rachel Severson, MS3; Nisha B. Alden, MPH3; Sharon Balter, MD4; Daniel Bertolino, MPH5; David Blythe, MD6; Shane Brady, MPH7; Betsy Cadwell, MSPH1; Iris Cheng, MS5; Sherri Davidson, PhD8; Janelle Delgadillo9; Katelynn Devinney, MPH5; Jeff Duchin, MD10; Monique Duwell, MD6; Rebecca Fisher, MPH4; Aaron Fleischauer, PhD11; Ashley Grant, MPH12; Jennifer Griffin, PhD4; Meredith Haddix, MPH4; Julie Hand, MSPH12; Matt Hanson, MD10; Eric Hawkins, MS13; Rachel K. Herlihy, MD3; Liam Hicks, MPH7; Corinne Holtzman, MPH14; Mikhail Hoskins, MPH11; Judie Hyun, MHS6; Ramandeep Kaur, PhD8; Meagan Kay, DVM10; Holly Kidrowski, MPH14; Curi Kim, MSPH6; Kenneth Komatsu, MPH7; Kiersten Kugeler, PhD1; Melissa Lewis, MPH1; B. Casey Lyons, MPH2; Shelby Lyons, MPH12; Ruth Lynfield, MD14; Keegan McCaffrey7; Chelsea McMullen, MS15; Lauren Milroy, MPH13; Stephanie Meyer, MPH14; Leisha Nolen, MD9; Monita R. Patel, PhD1; Sargis Pogosjans, MPH10; Heather E. Reese, PhD1; Amy Saupe, MPH14; Jessica Sell, MPH5; Theresa Sokol, MPH12; Daniel Sosin, MD15; Emma Stanislawski, MPH15; Kelly Stevens, MS8; Hailey Vest, MPH13; Kelly White, MPH13; Erica Wilson, MD11; Adam MacNeil, PhD1; Matthew D. Ritchey2; Benjamin J. Silk, PhD1
Publication Date: 10 Sept 2021
Publication Site: CDC, Morbidity and Mortality Weekly Report