Link: https://www.thelancet.com/journals/lanepe/article/PIIS2666-7762(23)00221-1/fulltext#secsectitle0010
DOI:https://doi.org/10.1016/j.lanepe.2023.100802
Graphic:
Excerpt:
Many countries, including the UK, have continued to experience an apparent excess of deaths long after the peaks associated with the COVID-19 pandemic in 2020 and 2021. Numbers of excess deaths estimated in this period are considerable. The UK Office for National Statistics (ONS) has calculated that there were 7.2% or 44,255 more deaths registered in the UK in 2022 based on comparison with the five-year average (excluding 2020). This persisted into 2023 with 8.6% or 28,024 more deaths registered in the first six months of the year than expected. The Continuous Mortality Investigation (CMI) found a similar excess (28,500 deaths) for the same period using different methods. Several methods can be used to estimate excess deaths, each with limitations which should be considered in interpretation, however the overall trends tend to be consistent across the various methods.
The causes of these excess deaths are likely to be multiple and could include the direct effects of Covid-19 infection, acute pressures on NHS acute services resulting in poorer outcomes from episodes of acute illness, and disruption to chronic disease detection and management. Further analysis by cause and by age- and sex-group may help quantify the relative contributions of these causes.
Since July 2020, the Office for Health Improvement and Disparities (OHID) has published estimates of excess mortality based on a Poisson regression model for England week by week, overall and decomposed by age, ethnicity, region and cause. This model finds that in the period from week ending 3rd June 2022 to 30th June 2023, excess deaths for all causes were relatively greatest for 50–64 year olds (15% higher than expected), compared with 11% higher for 25–49 and < 25 year olds, and about 9% higher for over 65 year old groups. While the median age of these groups has changed since 2020, age-standardised mortality analysis breaking down death rates by sex find clearer age differences still. The age-standardised CMI found similar patterns with the largest relative excess deaths for 2022 observed in young (20–44 years) and middle-aged (45–64 years) adults. These findings should be interpreted carefully because of greater than usual delay in registration of deaths in the latter part of 2022.
Several causes, including cardiovascular diseases, show a relative excess greater than that seen in deaths from all-causes (9%) over the same period (week ending 3rd June 2022–30th June 2023), namely: all cardiovascular diseases (12%), heart failure (20%), ischaemic heart diseases (15%), liver diseases (19%), acute respiratory infections (14%), and diabetes (13%).
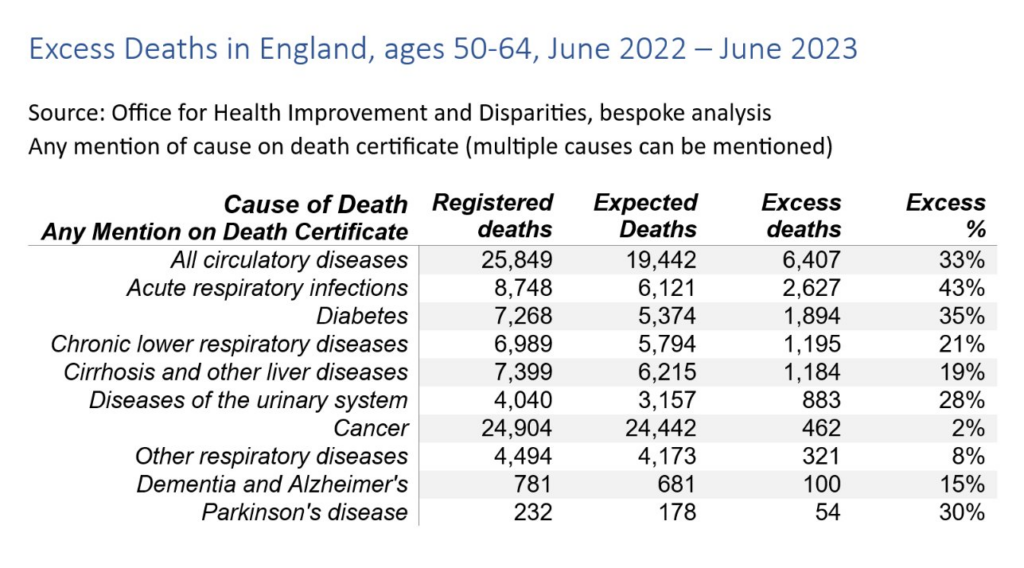
For middle-aged adults (50–64) in this 13-month period, the relative excess for almost all causes of death examined was higher than that seen for all ages. Deaths involving cardiovascular diseases were 33% higher than expected, while for specific cardiovascular diseases, deaths involving ischaemic heart diseases were 44% higher, cerebrovascular diseases 40% higher and heart failure 39% higher. Deaths involving acute respiratory infections were 43% higher than expected and for diabetes, deaths were 35% higher. Deaths involving liver diseases were 19% higher than expected for those aged 50–64, the same as for deaths at all ages.
Looking at place of death, from 3rd June 2022 to 30th June 2023 there were 22% more deaths in private homes than expected compared with 10% more in hospitals, but there was no excess in deaths in care homes and 12% fewer deaths than expected in hospices. For deaths involving cardiovascular diseases the relative excess in private homes was higher than all causes at 27%. Deaths in hospital were 8% higher and deaths in care homes only 3% higher.
The greatest numbers of excess deaths in the acute phase of the pandemic were in older adults. The pattern now is one of persisting excess deaths which are most prominent in relative terms in middle-aged and younger adults, with deaths from CVD causes and deaths in private homes being most affected. Timely and granular analyses are needed to describe such trends and so to inform prevention and disease management efforts. Leveraging such granular insights has the potential to mitigate what seems to be a continued and unequal impact on mortality, and likely corresponding impacts on morbidity, across the population.
Author(s):
Jonathan Pearson-Stuttard
Sarah Caul
Stuart McDonald
Emily Whamond
John N. Newton
Publication Date: 1 Dec 2023
Publication Site: The Lancet Regional Health Europe