Excess Death Rates for Republican and Democratic Registered Voters in Florida and Ohio During the COVID-19 Pandemic

Link: https://jamanetwork.com/journals/jamainternalmedicine/fullarticle/2807617

Graphic:

Excerpt:

Key Points

Question  Was political party affiliation a risk factor associated with excess mortality during the COVID-19 pandemic in Florida and Ohio?

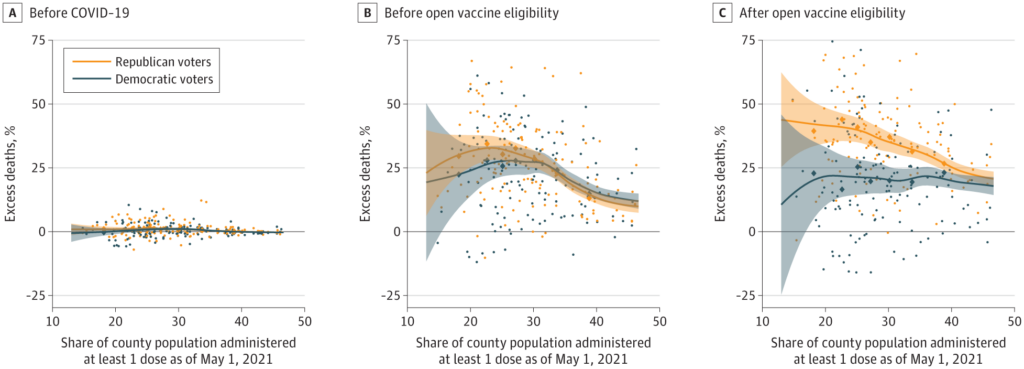
Findings  In this cohort study evaluating 538 159 deaths in individuals aged 25 years and older in Florida and Ohio between March 2020 and December 2021, excess mortality was significantly higher for Republican voters than Democratic voters after COVID-19 vaccines were available to all adults, but not before. These differences were concentrated in counties with lower vaccination rates, and primarily noted in voters residing in Ohio.

Meaning  The differences in excess mortality by political party affiliation after COVID-19 vaccines were available to all adults suggest that differences in vaccination attitudes and reported uptake between Republican and Democratic voters may have been a factor in the severity and trajectory of the pandemic in the US.

Abstract

Importance  There is evidence that Republican-leaning counties have had higher COVID-19 death rates than Democratic-leaning counties and similar evidence of an association between political party affiliation and attitudes regarding COVID-19 vaccination; further data on these rates may be useful.

Objective  To assess political party affiliation and mortality rates for individuals during the initial 22 months of the COVID-19 pandemic.

Design, Setting, and Participants  A cross-sectional comparison of excess mortality between registered Republican and Democratic voters between March 2020 and December 2021 adjusted for age and state of voter registration was conducted. Voter and mortality data from Florida and Ohio in 2017 linked to mortality records for January 1, 2018, to December 31, 2021, were used in data analysis.

Exposures  Political party affiliation.

Main Outcomes and Measures  Excess weekly deaths during the COVID-19 pandemic adjusted for age, county, party affiliation, and seasonality.

Results  Between January 1, 2018, and December 31, 2021, there were 538 159 individuals in Ohio and Florida who died at age 25 years or older in the study sample. The median age at death was 78 years (IQR, 71-89 years). Overall, the excess death rate for Republican voters was 2.8 percentage points, or 15%, higher than the excess death rate for Democratic voters (95% prediction interval [PI], 1.6-3.7 percentage points). After May 1, 2021, when vaccines were available to all adults, the excess death rate gap between Republican and Democratic voters widened from −0.9 percentage point (95% PI, −2.5 to 0.3 percentage points) to 7.7 percentage points (95% PI, 6.0-9.3 percentage points) in the adjusted analysis; the excess death rate among Republican voters was 43% higher than the excess death rate among Democratic voters. The gap in excess death rates between Republican and Democratic voters was larger in counties with lower vaccination rates and was primarily noted in voters residing in Ohio.

Conclusions and Relevance  In this cross-sectional study, an association was observed between political party affiliation and excess deaths in Ohio and Florida after COVID-19 vaccines were available to all adults. These findings suggest that differences in vaccination attitudes and reported uptake between Republican and Democratic voters may have been factors in the severity and trajectory of the pandemic in the US.

Author(s): Jacob Wallace, PhD1; Paul Goldsmith-Pinkham, PhD2; Jason L. Schwartz, PhD1

Publication Date: 24 July 2023

Publication Site: JAMA Internal Medicine

Japan’s average life expectancy continued to fall in 2022

Link:https://www.japantimes.co.jp/news/2023/07/28/japan/science-health/japans-average-life-expectancy-continued-to-fall-in-2022/?utm_source=pianoDNU&utm_medium=email&utm_campaign=72&tpcc=dnu&pnespid=.OSLjdNc5ajLp.m_r0X2sv8P_x4boCkkhVA4AlsotBCV3z1GVBtRNwqnyK4YG0tktTnV

Excerpt:

The average life expectancy fell for both Japanese men and women for the second consecutive year in 2022, a health ministry survey showed Friday.

The average life expectancy last declined for both sexes two years in a row in 2010 and 2011.

In 2022, the average life expectancy for men fell 0.42 years from 2021 to 81.05 years, and that for women dropped 0.49 years to 87.09 years. The drops were “largely due to the COVID-19 pandemic,” a ministry official said.

According to the ministry, the reported number of people who died after getting infected with the coronavirus rose to 47,635 in 2022 from 16,766 in 2021.

The pandemic is seen to have shortened the average life expectancy in 2022 by 0.12 years for men and 0.13 years for women, larger than 0.10 years and 0.07 years, respectively, in 2021.

….

In 2022, Japanese women had the highest average life expectancy in the world.

Japanese men ranked fourth, down by one place from the preceding year. Switzerland ranked first, followed by Sweden and Australia.

Of Japanese men born in 2022, 75.3% are expected to live until 75, 25.5% until 90 and 8.7% until 95. The proportion of Japanese women who are expected to live until 75, 90 and 95 stands at 87.9%, 49.8% and 25%, respectively.

Publication Date: 28 July 2023

Publication Site: The Japan Times

Report Highlights Public Health Impact of Serious Harms From Diagnostic Error in U.S.

Link:https://www.hopkinsmedicine.org/news/newsroom/news-releases/report-highlights-public-health-impact-of-serious-harms-from-diagnostic-error-in-us#:~:text=Results%20of%20the%20new%20analysis,of%20the%20public%20health%20problem.

Excerpt:

Improving diagnosis in health care is a moral, professional and public health imperative, according to the U.S. National Academy of Medicine. However, little is known about the full scope of harms related to medical misdiagnosis — current estimates range widely. Using novel methods, a team from the Johns Hopkins Armstrong Institute Center for Diagnostic Excellence and partners from the Risk Management Foundation of the Harvard Medical Institutions sought to derive what is believed to be the first rigorous national estimate of permanent disability and death from diagnostic error.  

The original research article was published July 17 by BMJ Quality & Safety. Results of the new analysis of national data found that across all clinical settings, including hospital and clinic-based care, an estimated 795,000 Americans die or are permanently disabled by diagnostic error each year, confirming the pressing nature of the public health problem.  

….

To identify their findings, researchers multiplied national measures of disease incidence by the disease-specific proportion of patients with that illness who experience errors or harms. Researchers repeated this method for the 15 diseases causing the most harms, then extrapolated to the grand total across all dangerous diseases. To assess the accuracy of the final estimates, the study’s authors ran the analyses under different sets of assumptions to measure the impact of methodological choices and then tested the validity of findings by comparing them with independent data sources and expert review. The resulting national estimate of 371,000 deaths and 424,000 permanent disabilities reflects serious harms widely across care settings, and it matches data produced from multiple prior studies that focused on diagnostic errors in ambulatory clinics and emergency departments and during inpatient care.  

Vascular events, infections and cancers, dubbed the Big Three, account for 75% of the serious harms. The study found that 15 diseases account for 50.7% of the total serious harms. Five conditions causing the most frequent serious harms account for 38.7% of total serious harms: stroke, sepsis, pneumonia, venous thromboembolism and lung cancer. The overall average error rate across diseases was estimated at 11.1%, but the rate ranges widely from 1.5% for heart attack to 62% for spinal abscess. The top cause of serious harm from misdiagnosis was stroke, which was found to be missed in 17.5% of cases.  

Author(s):  David Newman-Toker 

Publication Date: 17 July 2023

Publication Site: Johns Hopkins, press release

Suicides rose in Japan among young women and girls during pandemic

Link:https://www.japantimes.co.jp/news/2023/06/26/national/female-suicides-increase-pandemic/?utm_source=pianoT5&utm_medium=email&utm_campaign=295&tpcc=take5&pnespid=_uCIiYNau7Ha8vagqxixsvFPuxwV_XNzwhEqAks2oB2VA3_UbhwgFChCladWaMcGiWrj

Excerpt:

Researchers in Japan have found a significant increase in the number of suicides among women and girls between the ages of 10 and 24 during the pandemic, while there was no significant change in the suicide rate for boys and men in the same age group.

The research team analyzed data on suicides by gender across three age groups — 10 to 14, 15 to 19 and 20 to 24 — comparing the number of suicides after July 2020 with the number of suicides before the pandemic began.

According to the health ministry, the number of suicides among women and girls age between 10 and 24 in 2022 was 745, an increase of 233 compared with the 2019 figure. The data also showed that the number of boys and men in that age range who committed suicide was 1,278, an increase of 100 cases from 2019.

The research was led by Nobuyuki Horita from Yokohama City University Hospital and Sho Moriguchi from the Department of Neuroscience at Keio University using data on deaths by suicide from July 2012 to June 2022 provided by the health ministry.

…..

Over the past 10 years, a total of 13,263 young people age 10 to 24 — 9,428 male and 3,835 female — died by suicide.

Author(s): KARIN KANEKO

Publication Date: 26 June 2023

Publication Site: Japan Times

MBTA retirement fund is headed for a financial reckoning

Link: https://www.bostonglobe.com/2023/06/19/opinion/mbta-retirement-fund-finances/

Excerpt:

The MBTA Retirement Fund is going over a cliff, and the reasons why are well known. But neither the T nor its unions are in a hurry to do anything about it.

The new MBTA Retirement Fund Actuarial Valuation Report shows the fund’s balance as of Dec. 31, 2022, was $1.62 billion — about $300 million less than what it was just 12 months earlier. Its liability — the amount it will owe current and future T retirees — is over $3.1 billion, meaning the fund is about 51 percent funded. In 2006, it was 94 percent funded. A “death spiral” generally accelerates when retirement system funding dips below 50 percent.

In April, the Pioneer Public Interest Law Center got the MBTA to hand over an August 2022 arbitration decision regarding a pension dispute between the T and its biggest union. It contained a critical win for the authority: Arbitrator Elizabeth Neumeier decided that most employees would have to work until age 65 to earn a full pension, saving the MBTA at least $12 million annually.

But the Carmen’s Union sued to invalidate that portion of the decision, and the parties returned to the bargaining table. The new pension agreement they hammered out doesn’t include the historic retirement age victory; T management negotiated it away.

….

As of Dec. 31, 2022, 5,555 active employees paid into the fund, but 6,783 retirees collected from it. The biggest reason for the mismatch is the age at which T employees retire. Those hired before December 2012 can retire with a full pension after 23 years of service, regardless of age. Those hired after December 2012 can retire with a full pension at age 55 after 25 years.

The arbitrator finally gave the MBTA the win it so desperately needed, and T management promptly gave it back. Many MBTA managers have long opposed changing the age at which employees can earn a full pension, fearing the reaction of T unions.

….

Hard as it may be to believe, the T retirement fund’s financial outlook is even worse than it appears. Financial projections assume the fund’s assets will earn 7.25 percent annually. Over time, actual returns have been more like 4 percent to 7 percent.

These misleading projections are based on other faulty assumptions. In her 2022 decision, Neumeier refused the MBTA’s request to use newer actuarial tables, ruling that changing would be costly and that there was no compelling reason to update the tables. The ones in place are from 1989 — so old that they assume all T employees are men. Since women tend to live longer, the tables materially understate the retirement fund liability.

Author(s): Mark T. Williams, Charles Chieppo 

Publication Date: 19 Jun 2023

Publication Site: Boston Globe

$50 Billion in Opioid Settlement Cash Is on the Way. We’re Tracking How It’s Spent.

Link: https://kffhealthnews.org/news/article/opioid-drugmakers-settlement-funds-50-billion-dollars-khn-investigation-payback/

Graphic:

Excerpt:

More than $50 billion in settlement funds is being delivered to thousands of state and local governments from companies accused of flooding their communities with opioid painkillers that have left millions addicted or dead.

….

Most of the settlements stipulate that states must spend at least 85% of the money they will receive over the next 15 years on addiction treatment and prevention. But defining those concepts depends on stakeholders’ views — and state politics. To some, it might mean opening more treatment sites. To others, buying police cruisers.

….

What’s more, many states are not being transparent about where the funds are going and who will benefit. An investigation by KHN and Christine Minhee, founder of OpioidSettlementTracker.com, concluded only 12 states have committed to detailed public reporting of all their spending.

The analysis involved scouring hundreds of legal documents, laws, and public statements to determine how each state is divvying up its settlement money among state agencies, city and county governments, and councils that oversee dedicated trusts. The next step was to determine the level and detail of public reporting required. The finding: Few states promise to report in ways that are accessible to the average person, and many are silent on the issue of transparency altogether.

More than $3 billion has gone out to state and local governments so far. KHN will be following how that cash — and the billions set to arrive in coming years — is used.

Author(s): Aneri Pattani

Publication Date: 30 March 2023

Publication Site: Kaiser Health News

Suicide Mortality in the United States, 2001–2021

Link: https://www.cdc.gov/nchs/products/databriefs/db464.htm

Graphic:

Excerpt:

  • The total age-adjusted suicide rate increased from 10.7 deaths per 100,000 standard population in 2001 to a recent peak of 14.2 in 2018, and then declined to 13.5 in 2020. In 2021, the rate increased 4% to 14.1, the largest 1-year increase during the period (Figure 1).
  • The suicide rate for males did not change significantly from 2001 (18.2) through 2006 (18.1), and then increased to 22.8 in 2018. Rates declined in 2019 (22.4) and 2020 (22.0) but then increased 4% in 2021 (22.8).
  • The suicide rate for females increased from 2001 (4.1) through 2015 (6.0) and then did not change significantly through 2018 (6.2). Following a 2-year decline to 5.5 in 2020, the rate increased 4% in 2021 (5.7).
  • The suicide rate for males was three to four and one-half times the rate for females during the 2001–2021 period.

Author(s): Matthew F. Garnett, M.P.H., and Sally C. Curtin, M.A.

Publication Date: April 2023

Publication Site: National Center for Health Statistics, CDC

The American Addiction to Speeding

Link: https://slate.com/business/2021/12/speed-limit-americas-most-broken-law-history.html

Excerpt:

Speeding is a national health problem and a big reason why this country is increasingly an outlier on traffic safety in the developed world. More than 1 in 4 fatal crashes in the United States involve at least one speeding driver, making speeding a factor in nearly 10,000 deaths each year, in addition to an unknowable number of injuries. Thousands of car crash victims are on foot, and speed is an even more crucial determinant of whether they live or die: The odds of a pedestrian being killed in a collision rise from 10 percent at 23 mph to 75 percent at 50 mph. And we’re now in a moment of particular urgency. Last year, when the pandemic shutdowns lowered total miles traveled by 13 percent, the per-mile death rate rose by 24 percent—the greatest increase in a century, thanks to drivers hitting high velocities on empty roads. “COVID,” Roberts said, “was midnight on the day shift.”

In the first six months of 2021, projected traffic fatalities in the U.S. rose by 18 percent, the largest increase since the U.S. Department of Transportation started counting and double the rate of the previous year’s surge. “We cannot and should not accept these fatalities as simply a part of everyday life in America,” said Transportation Secretary Pete Buttigieg in a press release.

….

It is as strange as cigarettes on airplanes or dating ads in newspapers to think that between 1974 and 1995, the United States maintained a national speed limit of 55 miles per hour in the name of saving lives. It was one of those moments, like the end of the Concorde’s supersonic passenger jet service or the collapse of the Arecibo Telescope, when technology lurched backward.

The 50-state slowdown known as the “double nickel” began in 1973, with President Richard Nixon’s appeal for collective sacrifice. In retaliation for America’s support of Israel in the Yom Kippur War, the coalition of Middle Eastern states known as OPEC decided that fall to stop selling oil to the United States. Prices quadrupled. The president wanted Americans to change their ways: He asked gas stations to close on Sundays and businesses to turn off lighted advertisements. Mayors and department stores dimmed Christmas bulbs nationwide. Daylight saving time went year-round in an effort to use less electric light. Thanks to the lowered thermostat, women were permitted to wear pants in the White House.

….

But that did not come to pass. The number of annual auto deaths dropped below 44,000 in 1990 and has not passed that number since; instead, it fell to a 40-year low in 2014, despite enormous growth in the number of cars on the road. Every state has raised the speed limit over the past few decades, with parts of Texas now topping out at 80 mph.

….

Given all this, speeding enforcement could use a tighter focus. Relatively few motorists drive at what the National Highway Traffic Safety Administration calls “extreme speeds” of more than 20 mph over the limit. In the District of Columbia, it was just 6 percent of speeders in 2019. (One of them was going 132 mph in a 50 mph zone.) For a police-based enforcement system to be able to find and stop those drivers would be remarkably good luck. But those are exactly the drivers most likely to hurt themselves or others in a crash.

….

Speed cameras and speed traps have something in common: They both rely on the wisdom of speed limits, which are not very wise. The conventional wisdom in the field of traffic engineering is that the speed limit should be set according to the 85th percentile rule—at the speed of the 15th-fastest of 100 drivers on the road. City transportation officials do not like this method: The fastest 15 percent of drivers, they argue, are not always the most rational appraisers of what constitutes a safe speed. Nor should drivers’ interests determine the character of a street for its other users. In an essay in the Harvard Law Review, Greg Shill and Sara Bronin write, “The 85th Percentile Rule is perhaps unique in American law in empowering lawbreakers to activate a rewrite of the law to legalize their own unlawful conduct.”

Author(s): Henry Grabar

Publication Date: 15 Dec 2021

Publication Site: Slate

State Variation in Underreporting of Alcohol Involvement on Death Certificates: Motor Vehicle Traffic Crash Fatalities as an Example

Link: https://www.ncbi.nlm.nih.gov/pmc/articles/PMC3965684/

Graphic:

Abstract:

Abstract

Objective:

We used motor vehicle traffic (MVT) crash fatalities as an example to examine the extent of underreporting of alcohol involvement on death certificates and state variations.

Method:

We compared MVT-related death certificates identified from national mortality data (Multiple Cause of Death [MCoD] data) with deaths in national traffic census data from the Fatality Analysis Reporting System (FARS). Because MCoD data were not individually linked to FARS data, the comparisons were at the aggregate level. Reporting ratio of alcohol involvement on death certificates was thus computed as the prevalence of any mention of alcohol-related conditions among MVT deaths in MCoD, divided by the prevalence of decedents with blood alcohol concentration (BAC) test results (not imputed) of .08% or greater in FARS. Through bivariate analysis and multiple regression, we explored state characteristics correlated with state reporting ratios.

Results:

Both MCoD and FARS identified about 450,000 MVT deaths in 1999–2009. Reporting ratio was only 0.16 for all traffic deaths and 0.18 for driver deaths nationally, reflecting that death certificates captured only a small percentage of MVT deaths involving BAC of .08% or more. Reporting ratio did not improve over time, even though FARS indicated that the prevalence of BAC of at least .08% in MVT deaths increased from 19.9% in 1999 to 24.2% in 2009. State reporting ratios varied widely, from 0.02 (Nevada and New Jersey) to 0.81 (Delaware).

Conclusions:

The comparison of MCoD with FARS revealed a large discrepancy in reporting alcohol involvement in MVT deaths and considerable state variation in the magnitude of underreporting. We suspect similar underreporting and state variations in alcohol involvement in other types of injury deaths.

Author(s): I-Jen P Castle, Ph.D.,a,* Hsiao-Ye Yi, Ph.D.,a Ralph W Hingson, Sc.D.,b and Aaron M White, Ph.D.b

Publication Date: March 2014

Publication Site: Journal of Studies on Alcohol and Drugs, National Library of Medicine

Excess mortality and life expectancy

Link: https://ulflorr.substack.com/p/excess-mortality-and-life-expectancy

Graphic:

Fig. 1: Annual values of life expectancy in Germany with fit (blue). The fit did not respect the values for 2021 and 2022.

Excerpt:

Life expectancy is relatively difficult to calculate. The mortality risk has to be determined from death and population figures for each individual year of life. A hurdle is that data are often only available in age cohorts. So the missing values have to be interpolated. Using the mortality risks, a fictitious newborn cohort is projected forward year by year until all have died. A weighted average value is calculated from those who died each year in this modeled time series, yielding the life expectancy.

Life expectancy in Germany increased for many years until 2020, allthough this trend seemed to be gradually approaching a saturation point, which might be around 82 years (Fig. 1).

Author(s): ULF LORRÉ

Publication Date: 30 Mar 2023

Publication Site: Demographic Data Analysis

Excess Mortality and Years of Potential Life Lost Among the Black Population in the US, 1999-2020

Link:https://jamanetwork.com/journals/jama/article-abstract/2804822/

JAMA. 2023;329(19):1662-1670. doi:10.1001/jama.2023.7022

Excerpt:

Key Points

Question  How many excess deaths and years of potential life lost for the Black population, compared with the White population, occurred in the United States from 1999 through 2020?

Findings  Based on Centers for Disease Control and Prevention data, excess deaths and years of potential life lost persisted throughout the period, with initial progress followed by stagnation of improvement and substantial worsening in 2020. The Black population had 1.63 million excess deaths, representing more than 80 million years of potential life lost over the study period.

Meaning  After initial progress, excess mortality and years of potential life lost among the US Black population stagnated and then worsened, indicating a need for new approaches.

Author(s): César Caraballo, MD1,2; Daisy S. Massey, BA3; Chima D. Ndumele, PhD4; et al

Publication Date: 16 May 2023

Publication Site: JAMA Network