Graphic:
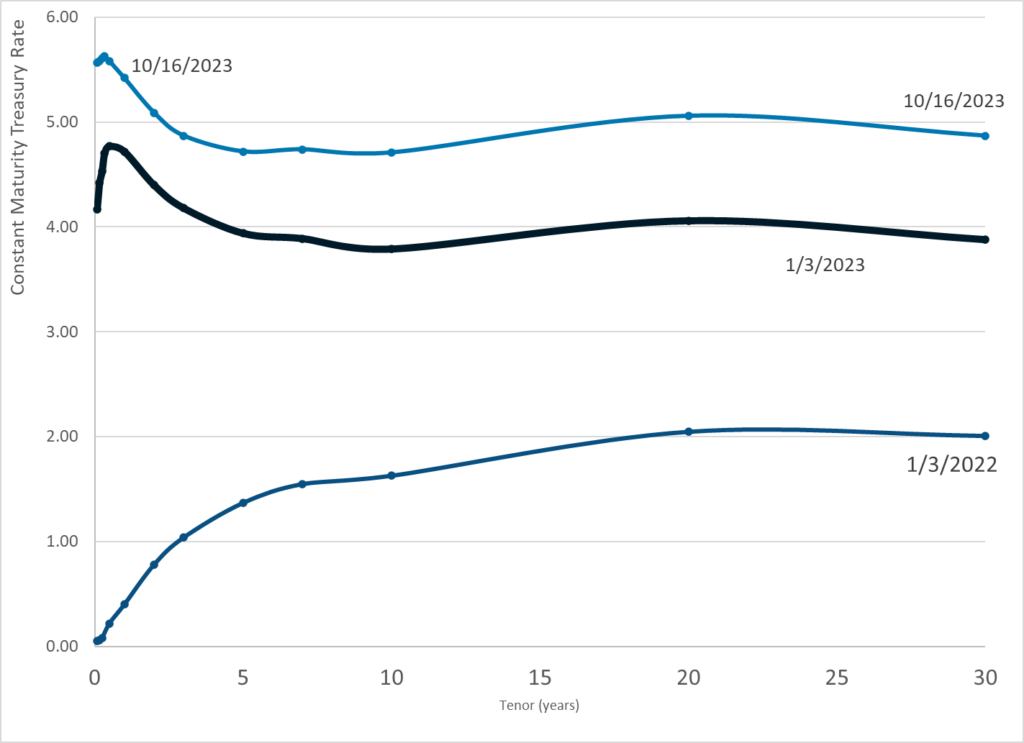
Publication Date: 16 Oct 2023
Publication Site: Treasury Dept
All about risk
Graphic:
Publication Date: 16 Oct 2023
Publication Site: Treasury Dept
Excerpt:
As consumers, regulators, and stakeholders demand more transparency and accountability with respect to how insurers’ business practices contribute to potential systemic societal inequities, insurers will need to adapt. One way insurers can do this is by conducting disparate impact analyses and establishing robust systems for monitoring and minimizing disparate impacts. There are several reasons why this is beneficial:
- Disparate impact analyses focus on identifying unintentional discrimination resulting in disproportionate impacts on protected classes. This potentially creates a higher standard than evaluating unfairly discriminatory practices depending on one’s interpretation of what constitutes unfair discrimination. Practices that do not result in disparate impacts are likely by default to also not be unfairly discriminatory (assuming that there are also no intentionally discriminatory practices in place and that all unfairly discriminatory variables codified by state statutes are evaluated in the disparate impact analysis).
- Disparate impact analyses that align with company values and mission statements reaffirm commitments to ensuring equity in the insurance industry. This provides goodwill to consumers and provides value to stakeholders.
- Disparate impact analyses can prevent or mitigate future legal issues. By proactively monitoring and minimizing disparate impacts, companies can reduce the likelihood of allegations of discrimination against a protected class and corresponding litigation.
- If writing business in Colorado, then establishing a framework for assessing and monitoring disparate impacts now will allow for a smooth transition once the Colorado bill goes into effect. If disparate impacts are identified, insurers have time to implement corrections before the bill is effective.
Author(s): Eric P. Krafcheck
Publication Date: 27 Sept 2021
Publication Site: Milliman
Graphic:
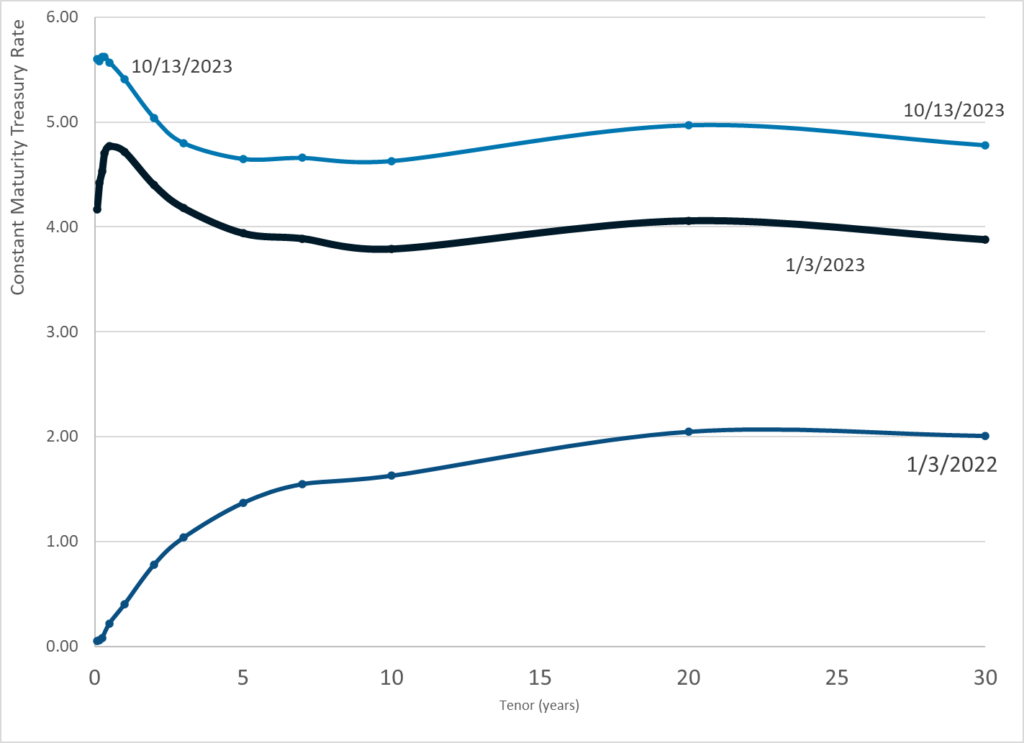
Publication Date: 13 Oct 2023
Publication Site: Treasury Department
Link: https://reason.com/video/2023/10/11/the-shady-statistics-behind-the-war-on-painkillers/
Graphic:
Excerpt:
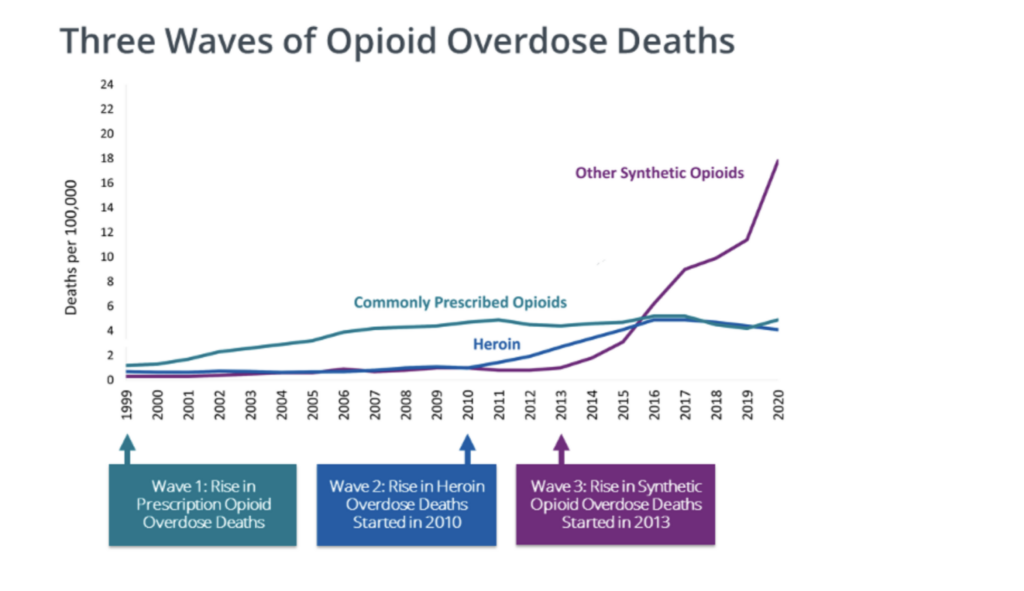
The attack on opioid prescriptions for non-cancer chronic pain began to advance around 2010, and intensified thereafter. The crackdown coincided with—and perhaps caused—a rapid growth in heroin overdose deaths, and later, an explosion in illegal synthetic opioid deaths, primarily fentanyl, an illicitly manufactured substance added to or substituted for heroin to meet the increasing demand for illegal opiates. This pattern of events is illustrated in a graphic put out by the Centers for Disease Control (CDC).
Indeed, overdose deaths from commonly prescribed opiates increased rapidly from 1999 to 2010, but the chart doesn’t tell us how many of the victims legally obtained the opiates. The chosen scale also omits the fact that drug overdose deaths have been increasing at a fairly steady rate since 1979, with no obvious changes associated with the rise and fall of opioid prescriptions for chronic pain. The chart does show how overdose death rates from commonly prescribed opiates did not decline much after 2010, although legal prescriptions went down dramatically. This suggests that these deaths may have involved individuals who bought illegally manufactured opiates, or that the people who lost pain medication as a result of official actions were not the ones liable to overdose.
The increase in deaths of despair obviously merits some policy attention, but labeling it an “opioid crisis,” as is common nowadays, profoundly misstates its nature, timing, and likely causes and solutions. To justify restricting opioids for non-cancer chronic pain patients requires specific evidence that people prescribed opioids for pain are the ones dying of overdoses. There’s quite a bit of negative evidence on this score, but public health officials have seized on a few positive studies to support their claims.
One influential and heavily cited 2011 study published in the Journal of the American Medical Association, “Association Between Opioid Prescribing Patterns and Opioid Overdose-Related Deaths,” uses a classic prohibitionist tactic. The authors use a sample of 750 Veterans Health Administration (VHA) patients who received opioid prescriptions for pain and later died of opioid overdoses, and compare them to a random sample of 155,000 other VHA patients who received opioid prescriptions and did not die of overdoses.
Author(s): Aaron Brown
Publication Date: 11 Oct 2023
Publication Site: Reason
Graphic:
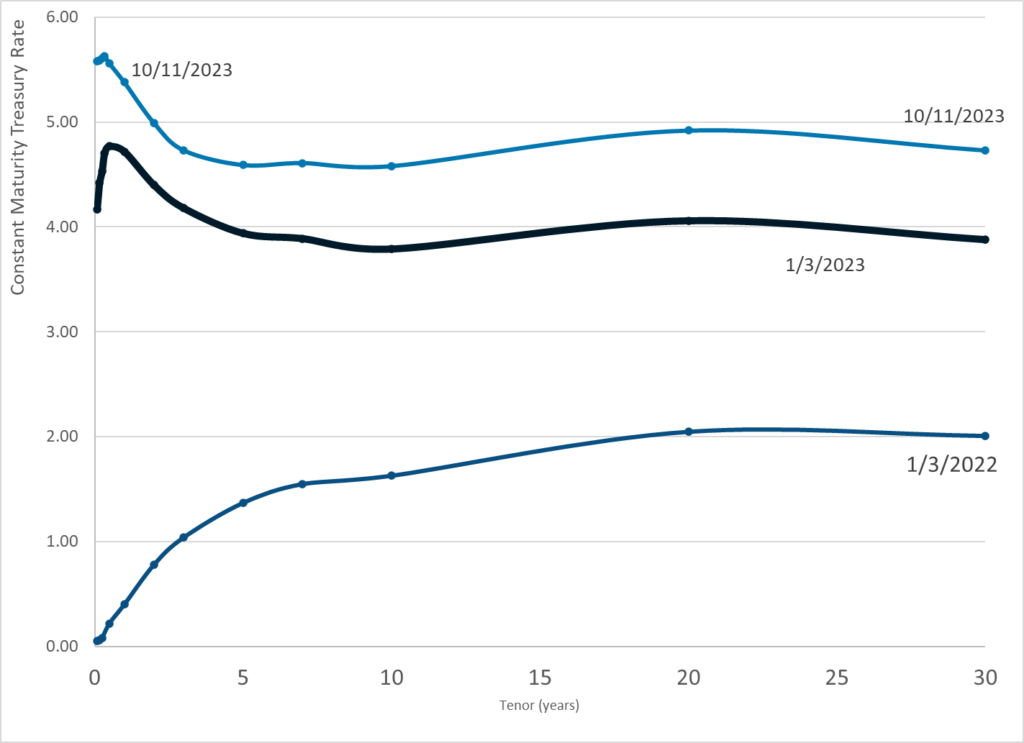
Publication Date: 11 Oct 2023
Publication Site: Treasury Department
Link: https://undark.org/2023/10/05/hospital-emissions-deaths/
Excerpt:
The average energy intensity of U.S. hospitals is more than twice that of European hospitals, with no comparable quality advantage. In recent years, less than 2 percent of hospitals were certified as energy efficient by the U.S. Environmental Protection Agency’s Energy Star program, and only 0.6 percent, or 37 in total, have been certified for 2023. As a result, in 2018, the U.S. health care industry emitted approximately 610 million tons of greenhouse gases, or GHGs — the equivalent of burning 619 billion pounds of coal. This represented 8.5 percent of U.S. GHG emissions that year, and about 25 percent of global health care emissions.
If U.S. health care were its own country, it would rank 11th worldwide in GHG pollution. If every nation produced an equivalent per capita volume of health care emissions, it would immediately consume nearly the entire global carbon budget required to limit global warming to 1.5 degrees Celsius (2.7 degrees Fahrenheit) by 2030. Without even considering their global impact, air pollution from U.S. emissions accounts for an estimated 77,000 excess deaths annually in the U.S. alone. And according to one 2016 study, emissions from the U.S. health care system lead to the loss of more than 400,000 years of healthy life among Americans. This level of harm is commensurate with the tens of thousands of deaths attributable to medical errors each year, around which a massive patient safety movement has been organized in response. But despite these human costs — along with sizable financial costs — there has been no parallel policy movement to address the health care industry’s role in undermining health through its GHG emissions.
Author(s): DAVID INTROCASO & ERIC REINHART
Publication Date: 5 Oct 2023
Publication Site: Undark
Link: https://content.naic.org/research_moody.htm
Excerpt: September 2023: 5.72%
Graphic:
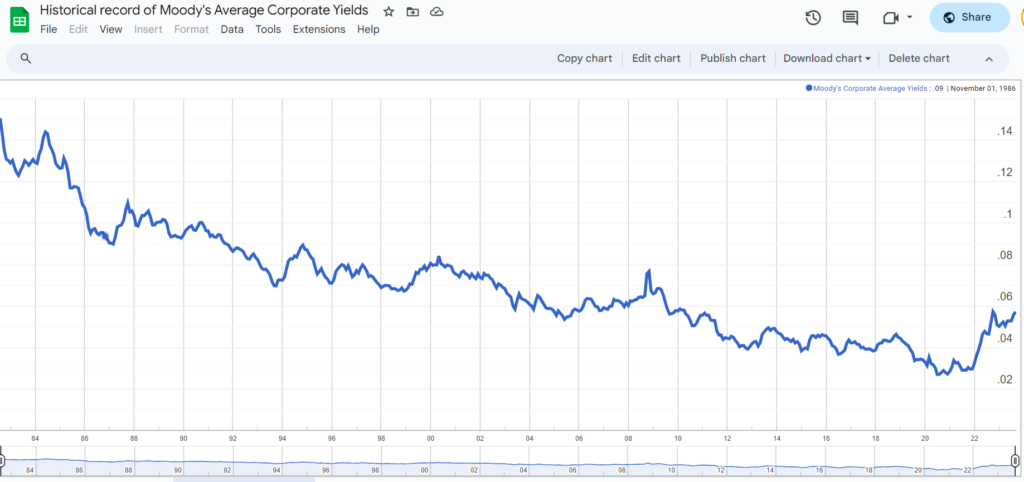
Publication Date: accessed 11 Oct 2023
Publication Site: NAIC
Graphic:
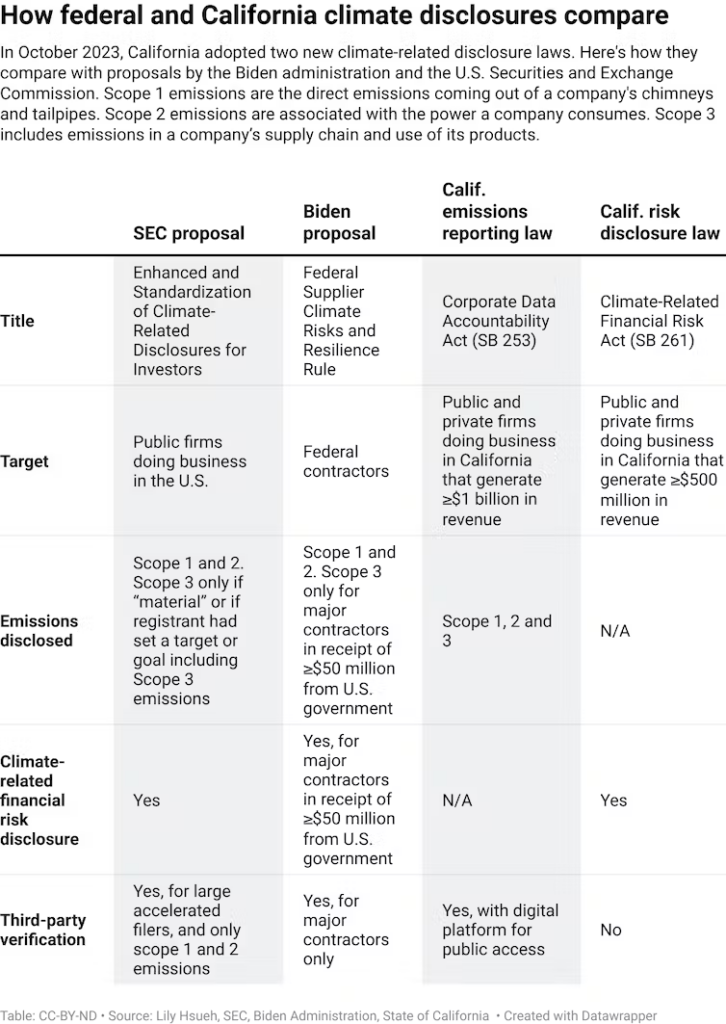
Excerpt:
Many of the world’s largest public and private companies will soon be required to track and report almost all of their greenhouse gas emissions if they do business in California – including emissions from their supply chains, business travel, employees’ commutes and the way customers use their products.
That means oil and gas companies like Chevron will likely have to account for emissions from vehicles that use their gasoline, and Apple will have to account for materials that go into iPhones.
It’s a huge leap from current federal and state reporting requirements, which require reporting of only certain emissions from companies’ direct operations. And it will have global ramifications.
California Gov. Gavin Newsom signed two new rules into law on Oct. 7, 2023. Under the new Climate Corporate Data Accountability Act, U.S.- companies with annual revenues of US$1 billion or more will have to report both their direct and indirect greenhouse gas emissions starting in 2026 and 2027. The California Chamber of Commerce opposed the regulation, arguing it would increase companies’ costs. But more than a dozen major corporations endorsed the rule, including Microsoft, Apple, Salesforce and Patagonia.
Author(s): Lily Hsueh
Publication Date: 10 Oct 2023
Publication Site: The Conversation
Graphic:
Publication Date: 10 Oct 2023
Publication Site: Treasury Dept
Link: https://scrippsnews.com/stories/despite-vehicle-safety-improvements-us-pedestrian-deaths-soar/
Graphic:
Excerpt:
Samuel’s death is part of a growing trend in America, where pedestrian and cyclist fatalities are up 60% since 2011 to more than 8,000 last year.
In the past 25 years, the percentage of people who died in road crashes — while inside a vehicle — dropped from 80% of all road deaths to 66%. At the same time, the share of pedestrian and bicyclist deaths climbed sharply – making up 20% of all road deaths in 1997, to now accounting for 34% of all road deaths.
Nicole Brunet is with the nonprofits Bicycle Coalition of Greater Philadelphia and Families for Safe Streets. She says street design is part of the issue.
“If you’re somebody in a car, the street is designed perfect for you,” Brunet said. “The ideal street is balanced: A street that’s built for a pedestrian and a bicyclist, somebody that has mobility issues. We need to think about the most vulnerable user of the road.”
Author(s): Maya Rodriguez
Publication Date: 5 Oct 2023
Publication Site: Scripps
Graphic:
Publication Date: 6 Oct 2023
Publication Site: Treasury Department
Graphic:
Publication Date: 4 Oct 2023
Publication Site: Treasury Department