Link: https://ctmirror.org/2022/04/18/why-driving-needs-to-feel-less-safe/
Excerpt:
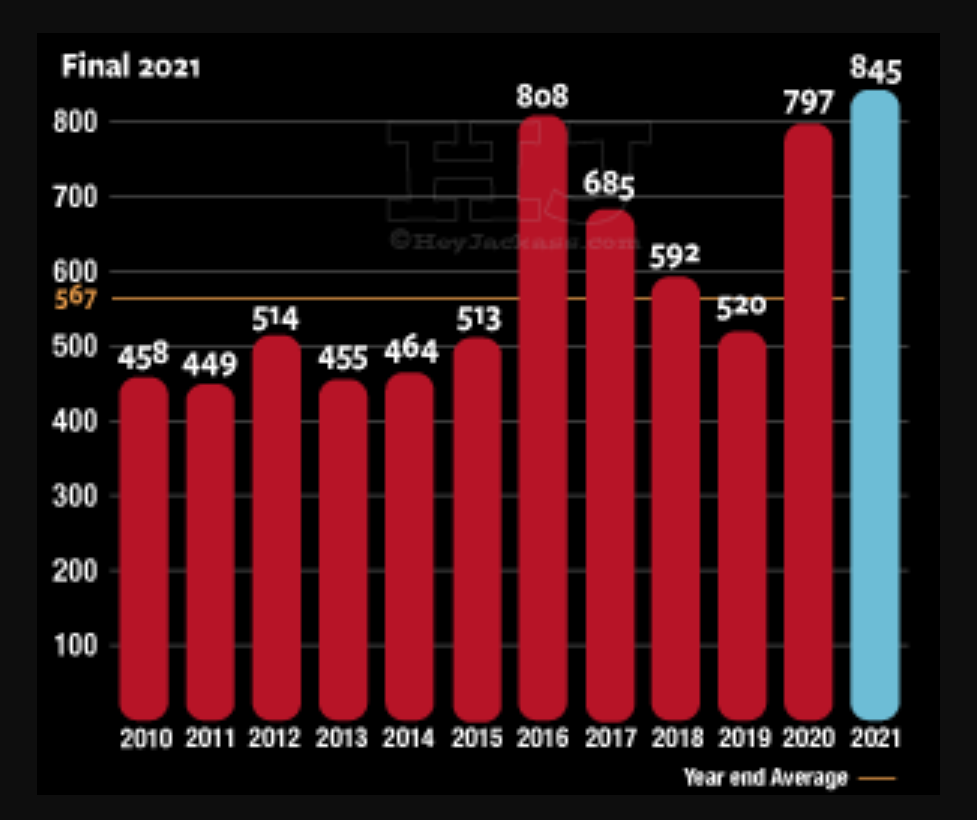
Motor vehicle fatalities in Connecticut have risen dramatically since the pandemic, echoing a trend that we’ve seen across the country. About 300 people are killed annually on Connecticut’s streets by motor vehicles, and about 100 times as many people (roughly 30,000) suffer injuries severe ePnough to warrant hospital admission.
Nationally, these figures are roughly 40,000 deaths and 3.4 million injuries per year. The U.S. is an outlier among developed countries in the number of deaths that we tolerate on our roads, with a death rate 2 to 3 times that of similarly wealthy countries. The human cost of this carnage leaves no one untouched: almost everyone knows at least one person killed by a vehicle, not to mention millions of others who suffer from life-altering consequences like paralysis and traumatic brain injuries.
If we truly care about saving lives and preventing injuries, we need to change the mindset by which we view the act of driving.
Author(s): Dice Oh
Publication Date: 18 April 2022
Publication Site: CT Mirror