Link: https://www.cdc.gov/mmwr/volumes/73/wr/mm7331a1.htm?s_cid=mm7331a1_w
Graphic:
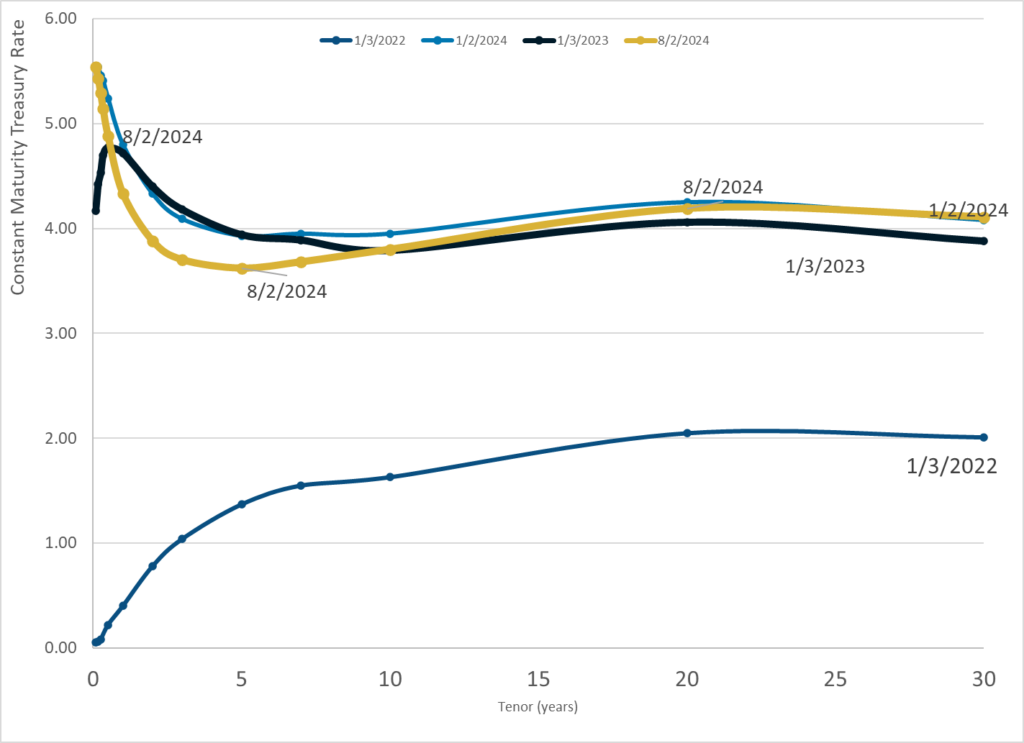
FIGURE 1. Provisional* number of COVID-19–associated deaths† and other deaths and percentage of deaths associated with COVID-19, by week of death — National Vital Statistics System, United States, 2023
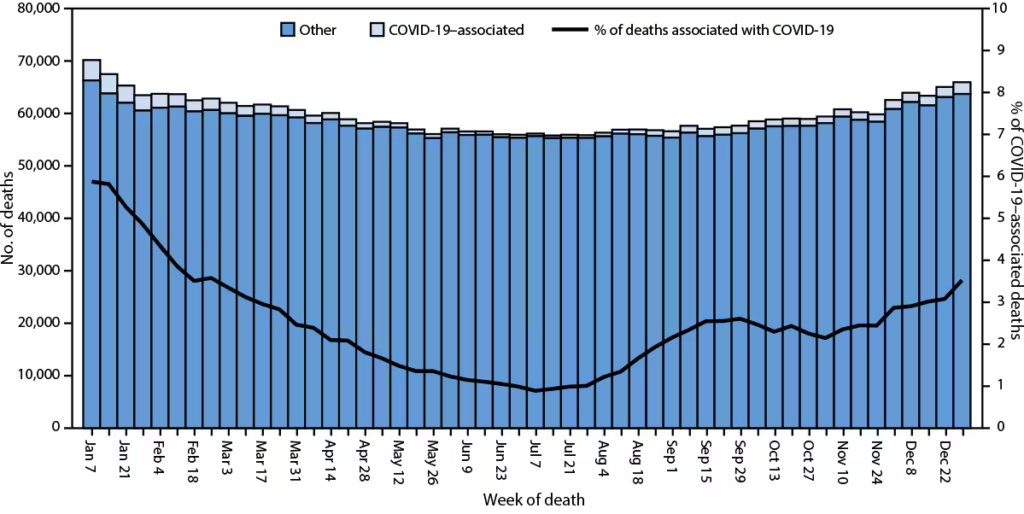
* National Vital Statistics System provisional data for 2023 are incomplete. Data from December 2023 are less complete because of reporting lags. These data exclude deaths that occurred in the United States among residents of U.S. territories and foreign countries.
† Deaths with confirmed or presumed COVID-19 as an underlying or contributing cause of death, with International Classification of Diseases, Tenth Revision code U07.1.
Excerpt:
Abstract
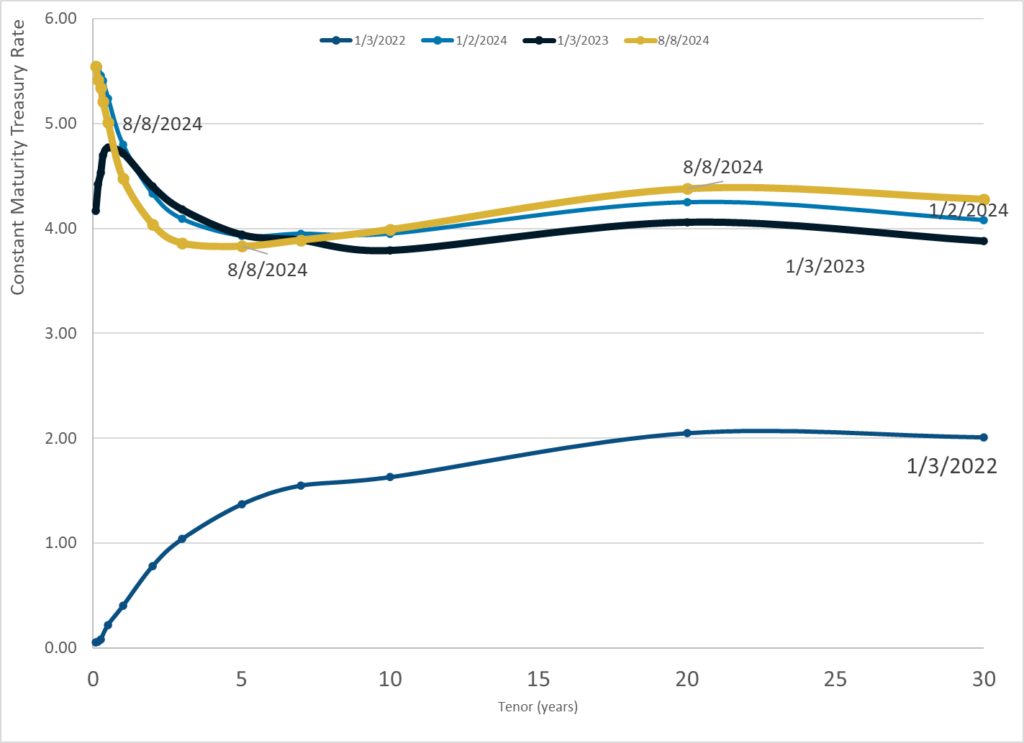
Final annual mortality data from the National Vital Statistics System for a given year are typically released 11 months after the end of the calendar year. Provisional data, which are based on preliminary death certificate data, provide an early estimate of deaths before the release of final data. In 2023, a provisional total of 3,090,582 deaths occurred in the United States. The age-adjusted death rate per 100,000 population was 884.2 among males and 632.8 among females; the overall rate, 750.4, was 6.1% lower than in 2022 (798.8). The overall rate decreased for all age groups. Overall age-adjusted death rates in 2023 were lowest among non-Hispanic multiracial (352.1) and highest among non-Hispanic Black or African American persons (924.3). The leading causes of death were heart disease, cancer, and unintentional injury. The number of deaths from COVID-19 (76,446) was 68.9% lower than in 2022 (245,614). Provisional death estimates provide an early signal about shifts in mortality trends. Timely and actionable data can guide public health policies and interventions for populations experiencing higher mortality.
Author(s): Farida B. Ahmad, MPH1; Jodi A. Cisewski, MPH1; Robert N. Anderson, PhD
Publication Date: 8 Aug 2024
Publication Site: CDC, MMWR Morbidity/Mortality Weekly Report
Suggested citation for this article: Ahmad FB, Cisewski JA, Anderson RN. Mortality in the United States — Provisional Data, 2023. MMWR Morb Mortal Wkly Rep 2024;73:677–681. DOI: http://dx.doi.org/10.15585/mmwr.mm7331a1