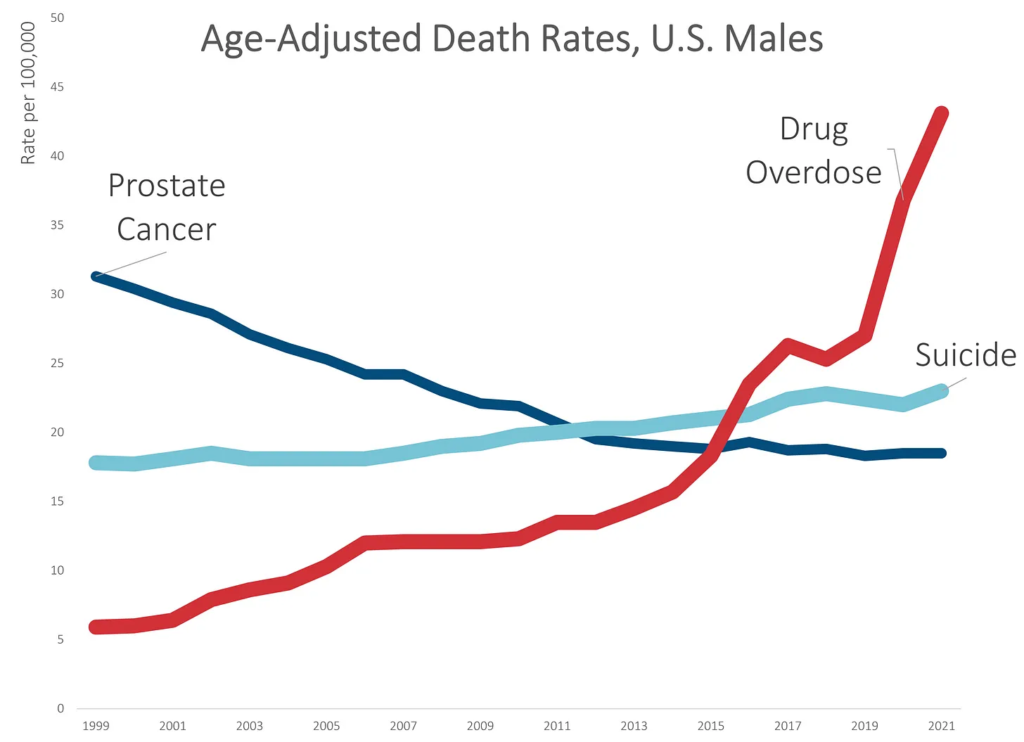
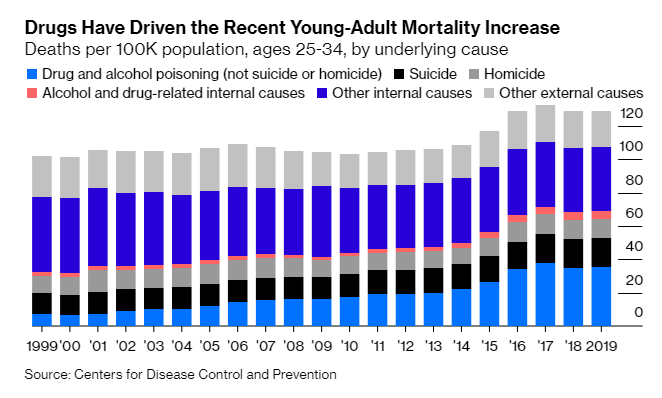
While death rates due to suicide increased by about 30% over the 20-year period, death rates due to unintentional drug overdoses increased by over 500%.
None of this is really a surprise. I’ve written about the drug OD problem many times before, which had a horrible trend before the pandemic and got much, much worse during the pandemic.
Much of the increase came in 2020 and 2021 — over 30% in 2020, and 17% in 2021. These are huge increases on rates that were already bad.
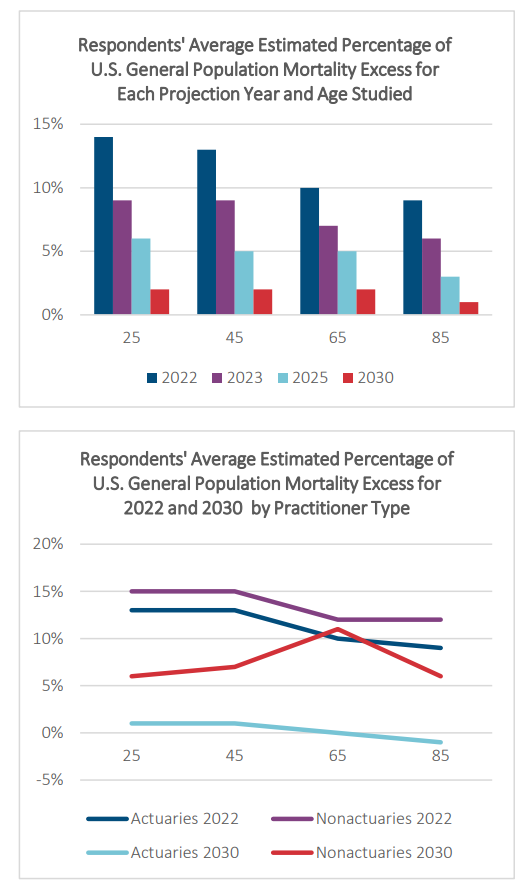
Excess mortality is expected to occur for all years studied with amounts varying by year and age. Although the largest mortality excess numbers for the U.S. general population are foreseen for 2022, excess mortality is expected to decline each year so that by 2030, excess mortality numbers are nearing expected levels. For 2030, mortality is projected to be 2% higher than expected for all ages except age 85. At this age, 2030 projected mortality is estimated to be 1% higher than expected.
Based on the average of the participants, generally, the amount of mortality excess is anticipated to be highest at the younger ages. For example, for 2022, projected mortality is anticipated to be 14% higher compared to expected levels for age 25, 13% higher for age 45, and 10% higher for ages 65 and 85.
Age-adjusted death rates are weighted averages of the age-specific death rates, where the weights represent a fixed population by age. They are used to compare relative mortality risk among groups and over time. An age-adjusted rate represents the rate that would have existed had the age-specific rates of the particular year prevailed in a population whose age distribution was the same as that of the fixed population. Age-adjusted rates should be viewed as relative indexes rather than as direct or actual measures of mortality risk.
The year “2000 U.S. standard” is the default population selection for the calculation of age-adjusted rates. However, you can select other standard populations, or select specific population criteria to determine the age distribution ratios. See Frequently Asked Questions about Death Rates for more information.
The rates of almost all causes of death vary by age. Age adjustment is a technique for “removing” the effects of age from crude rates, so as to allow meaningful comparisons across populations with different underlying age structures. For example, comparing the crude rate of heart disease in Florida to that of California is misleading, because the relatively older population in Florida will lead to a higher crude death rate, even if the age-specific rates of heart disease in Florida and California are the same. For such a comparison, age-adjusted rates are preferable. Age-adjusted rates should be viewed as relative indexes rather than as direct or actual measures of mortality risk.
The National Center for Health Statistics (NCHS) age-adjusts death rates using the direct method. That is, by applying age-specific death rates (Ri) to the U.S. standard population age distribution.
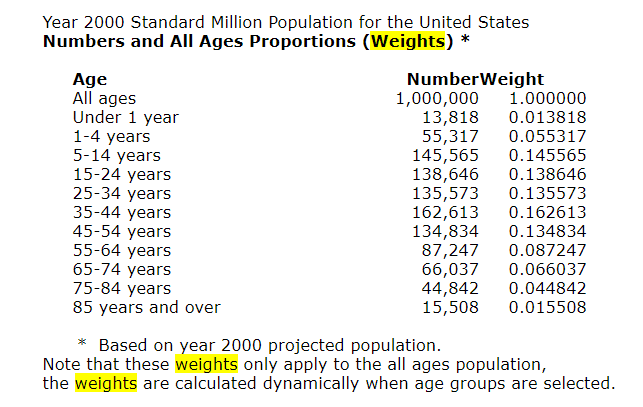
R’ = S i ( Psi / Ps ) R i
where Psi is the standard population for age group i and Ps is the total U.S. standard population (all ages combined).
In the direct method, a standard age distribution is chosen and the age-specific death rates are weighted according to the standard. A reasonable choice for the standard is the U.S. total population (all races, both genders) for the year under study. To permit comparison of death rates from year to year, a standard population is used. Beginning with the 1999 data year, NCHS adopted the year 2000 projected population of the United States as the standard population. This new standard replaces the 1940 standard population that was used by NCHS for over 50 years. The new population standard affects the level of mortality and to some extent trends and group comparisons. Of particular note are the effects on race comparison of mortality. For detailed discussion, see:Anderson RN, Rosenberg HM. Age standardization of death rates: Implementation of the year 2000 standard. National Vital Statistics Reports; vol 47 no 3. Hyattsville, Maryland. National Center for Health Statistics. 1998.Beginning with publications of the year 2003 data, the traditional standard million population along with corresponding standard weights to six decimal places were replaced by the projected year 2000 population age distribution (see 2000 Standard Population below). The effect of the change is negligible and does not significantly affect comparability with age-adjusted rates calculated using the previous method.
Publication Date: Accessed 21 May 2022, last reviewed 2 March 2022
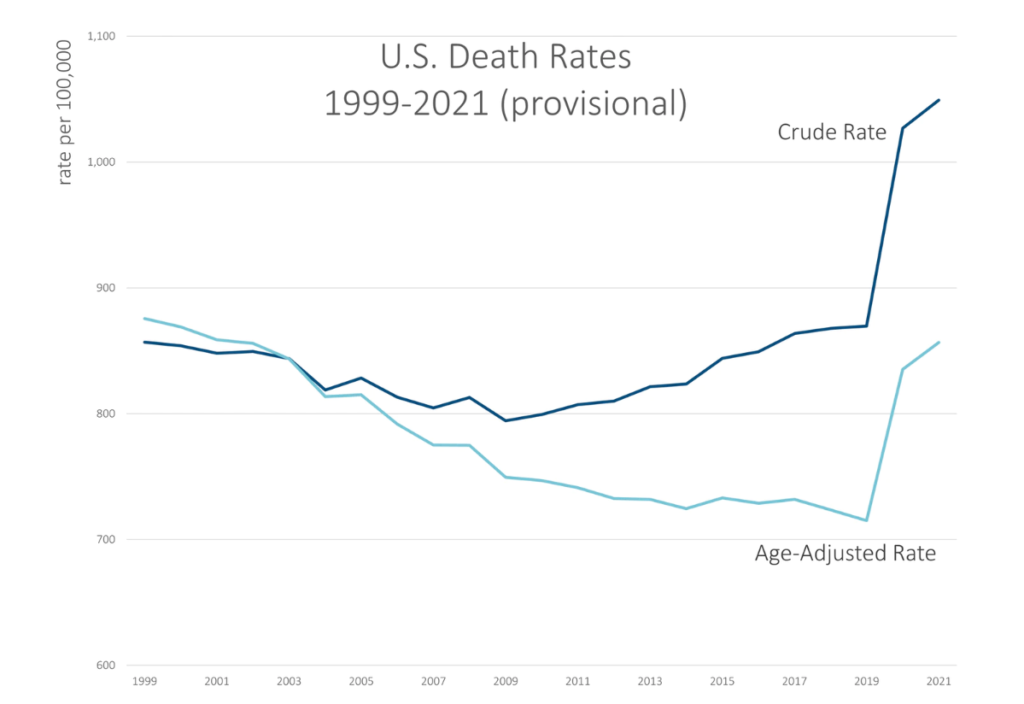
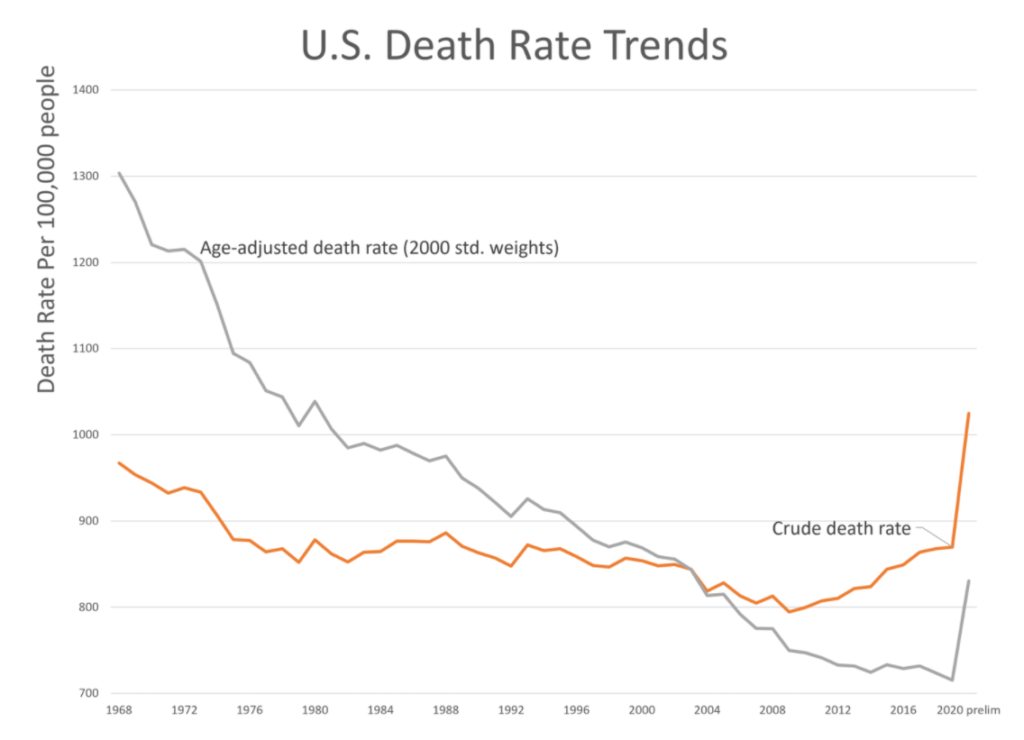
Here’s a graph for 1999 through the provisional 2021 result (as of 3 April 2022 data from CDC WONDER):
You can see the crude rate is higher than the age-adjusted rate for most of the years, and that’s due to the aging of the population. Basically, the Boomers have been getting older, and their older ages (and higher mortality compared to where they were in 2000), have an effect on how many deaths there are overall — thus the crude rate continually increasing as there are more and more old people.
However, until the pandemic hit, the age-adjusted death rate in general decreased, though we had a few years in the 2010s in which the age-adjusted death rate did increase… and yes, that was due to drug overdoses. We will get to that in a bit.
In any case, both the crude rate and age-adjusted rates did jump up by a lot in 2020 due to the pandemic, and COVID deaths were even higher in 2021. But there were other causes of death also keeping mortality rates high in 2021.
I will point out that even with all this extra mortality, the age-adjusted death rate in 2021 is still below where it was in 1999.
That does not mean things are hunky-dory.
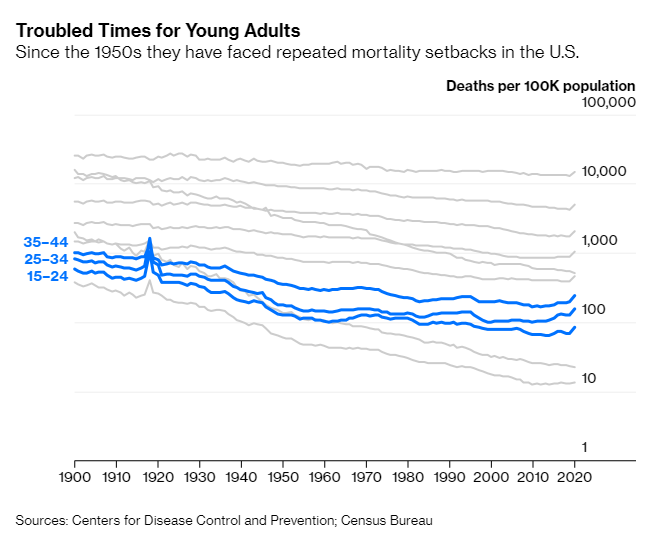
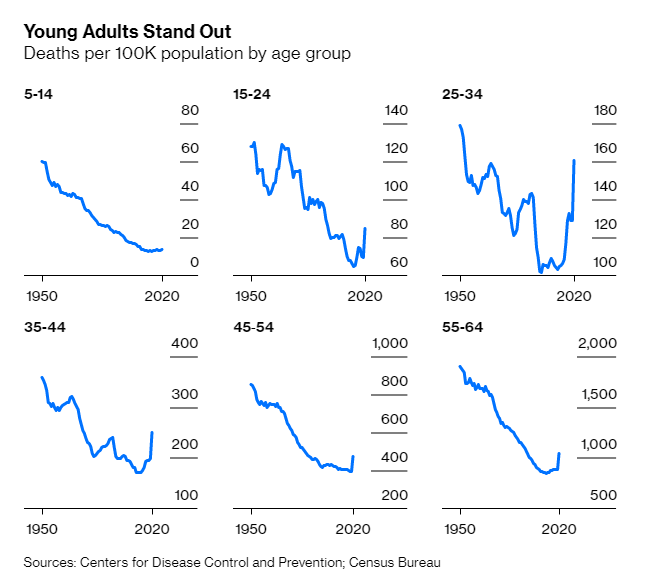
This is one of the dangers of collapsing death rates into a single number. The increase in death rates has differed by age group, and it has been far worse for teens and young adults through even young middle-age than it has been for the oldest adults.
Yes, COVID has killed the oldest adults the most, but their death rates have increased the least. It’s all relative.
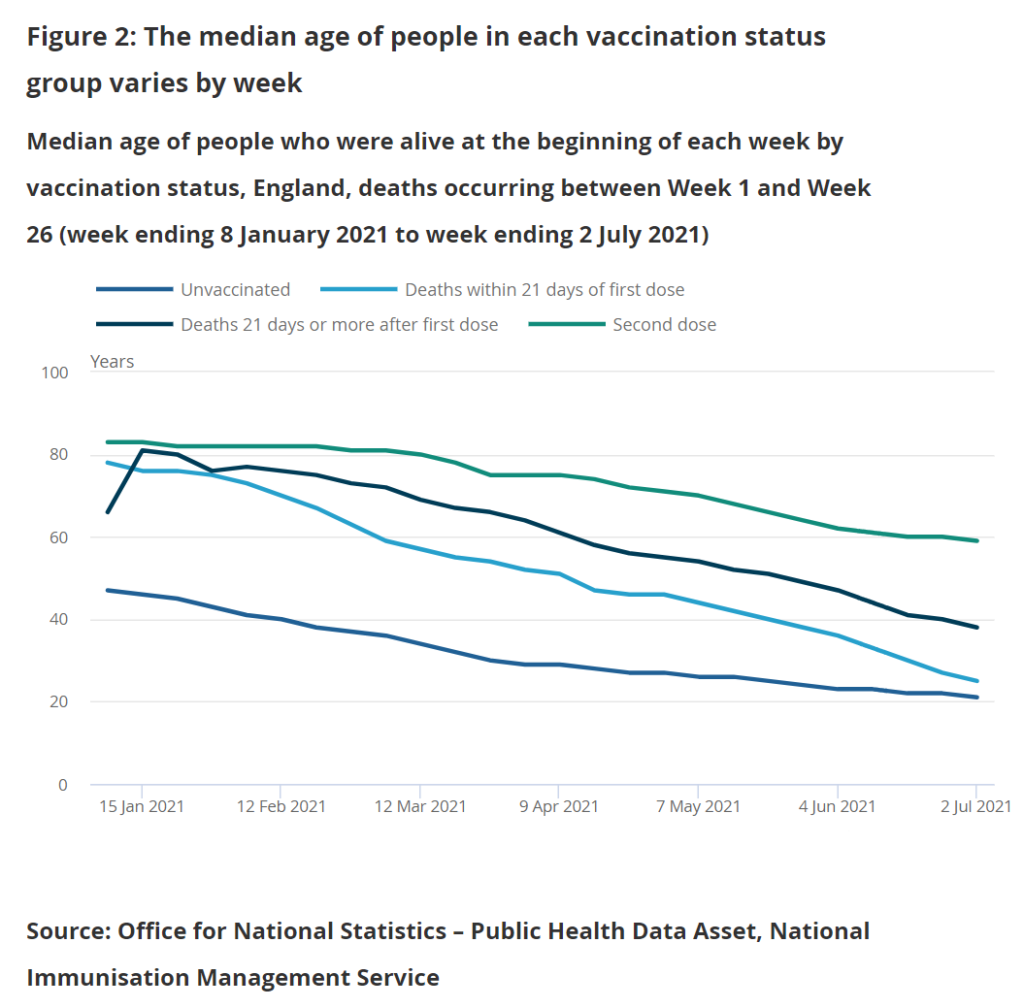
Age-standardised mortality rates are calculated for vaccination status groups using the Public Health Data Asset (PHDA) dataset. The PHDA is a linked dataset combining the 2011 Census, the General Practice Extraction Service (GPES) data for pandemic planning and research, and the Hospital Episode Statistics (HES). We linked vaccination data from the National Immunisation Management Service (NIMS) to the PHDA based on NHS number, and linked data on positive coronavirus (COVID-19) Polymerase Chain Reaction (PCR) tests from Test and Trace to the PHDA, also based on NHS number.
The PHDA dataset contains a subset of the population and allows for analyses to be carried out that require a known living population with known characteristics. These characteristics include age-standardised mortality rates (ASMRs) by vaccination status and the use of variables such as health conditions and census characteristics.
The crude death rate in 2019, pre-pandemic, was 870 per 100,000 people.
There was a similar crude death rate in 1989 (871 per 100,000) — do we really believe that the mortality experience, across the board, was the same thirty years apart?
This is the reason there is the same crude death rate in the two years: the age structure of the population was very different.
….
The main point, though, was that the population skewed younger in 1989 than in 2019. The median age in the U.S. was 38.4 in 2019. It was 32.9 years old in 1989.
In 1989, only 12.4% of the population was age 65 or older. In 2019, we had 16.5% of the population in that age bucket.
The changing age structure means that one can have mortality rates trending down for all ages, but the crude death rate climbs because the population is getting older. It’s definitely driven by people living longer (due to those lower mortality rates), but also driven by fewer babies being born.
The observation that downward mortality trends have reversed in recent years for some groups of Americans is not new. Economists Ann Case and Angus Deaton helped start the discussion with their 2015 paper on rising mortality among middle-aged, non-Hispanic White Americans, and subsequently gave the phenomenon a resonant name: “deaths of despair.” Research has also identified those without college degrees and rural Americans as especially troubled.
In March, a National Academies of Sciences, Engineering, and Medicine committee summed up the current state of knowledge in a 475-page report on “High and Rising Mortality Rates Among Working-Age Adults.” Advances in overall life expectancy stalled in the U.S. after 2010 even while continuing in other wealthy countries, the committee summed up, attributing this mainly to (1) rising mortality due to external causes such as drugs, alcohol and suicide among those aged 25 through 64 and (2) a slowing in declines in deaths from internal causes, chiefly cardiovascular diseases.
The aim of this site is to give comprehensible information about trends for cause-specific mortality in different population. Charts may be viewed or downloaded after choice of population, age group and cause of death group. The measures shown in the charts have been calculated using open data from WHO (2017), but the WHO are not responsible for any content on the site. For some countries where population is not available from WHO (2017) for recent years, estimates from United Nations Department of Economic and Social Affairs, Population Division (2015) is used instead.
There are several other websites with visualizations of mortality trends. One of the most advanced is IHME (2015), which contains data for all countries in the world, and uses complicated algorithms to adjust for uncertainties in the underlying data. On this website, the charts are generated dynamically, and the sites may sometimes be slow. Moreover, the visualizations do not go further back in time than 1980, while WHO (2017) has data available from 1950, for several populations. Whitlock (2012) is a website with a great number of static charts based on WHO (2017). This website is no longer maintained, however, because its creator has died.
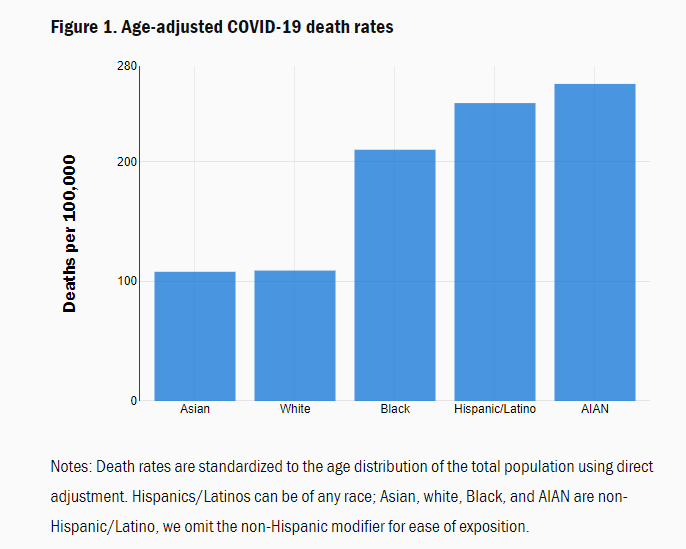
According to Centers for Disease Control (CDC) data, the age-adjusted COVID-19 mortality rate is now higher for AIAN people than for any other group (Figure 1); it is almost two and a half times the death rate for whites and Asians.[2] Figure 1 also shows that the disparities for Blacks and Hispanics/Latinos relative to whites, that we identified in June, remain substantial.[3] (That post also explains why it is important to adjust for age when comparing across groups.)