Link: https://www.soa.org/resources/research-reports/2025/qmmr-us-population/
Graphic:
Excerpt:
Key findings are as follows:
- For the U.S. population considered as a whole, the age-standardized death rate for the 12-month period from April 2024 to March 2025 was 849.7 (per 100,000 persons), compared to 845.5 for the 12-month period from January to December 2024. This is an increase of 0.49%. Despite this increase, the 12-month death rate remains slightly below the level observed in 2019.
- The 0.49% increase occurred because the death rate for the first quarter (Q1) of 2025 was 1.6% greater than the rate for Q1-2024 (which dropped out of the 12-month trailing period).
- Prior to Q1-2025, the 12-month trailing death rate had declined steadily since Q4-2021.
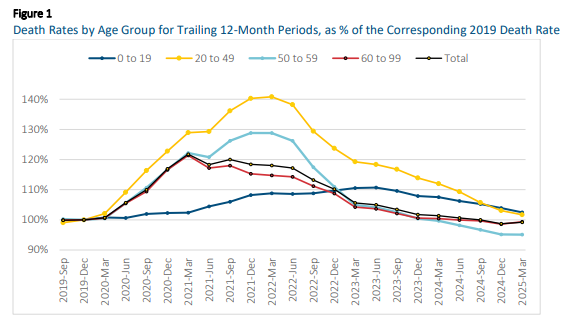
- Although mortality increased in Q1-2025 for the U.S. population considered as a whole, mortality improvement continued to occur across younger ages. For ages under 50, mortality experience in Q1-2025 contributed to a 1% to 2% decrease in the 12-month trailing death rate; for ages 50 to 59, the 12-month death rate remained essentially unchanged, and for ages 60 and above, the 12-month death rate increased by about 0.75%.
Along with this report, an updated version of the QMMR Excel/VBA workbook was released. The updated workbook contains data from 2000 through March 2025, disaggregated by sex, single age, and 14 broad categories of mortality causes. The workbook provides several tools to facilitate the analysis of mortality trends, including interactive, parameterized graphs that make it easy to visualize trends in the data.
Author(s): SOA Quarterly Mortality Monitoring Oversight Group
Larry Stern, FSA, MAAA
Sam Gutterman, FSA, MAAA, FCAS, FCA, HONFIA, CERA
Ed Hui, FSA
Tom Kukla, FSA, MAAA
Publication Date: June 2025
Publication Site: SOA Research Institute