Link: https://beta.healthdata.gov/National/COVID-19-Community-Profile-Report/gqxm-d9w9
Example Graphic:

Date Accessed: 30 January 2021
Publication Site: Healthdata.gov
All about risk
Link: https://beta.healthdata.gov/National/COVID-19-Community-Profile-Report/gqxm-d9w9
Example Graphic:
Date Accessed: 30 January 2021
Publication Site: Healthdata.gov
List: https://marypatcampbell.substack.com/p/mortality-with-meep-us-excess-mortality
Graph:
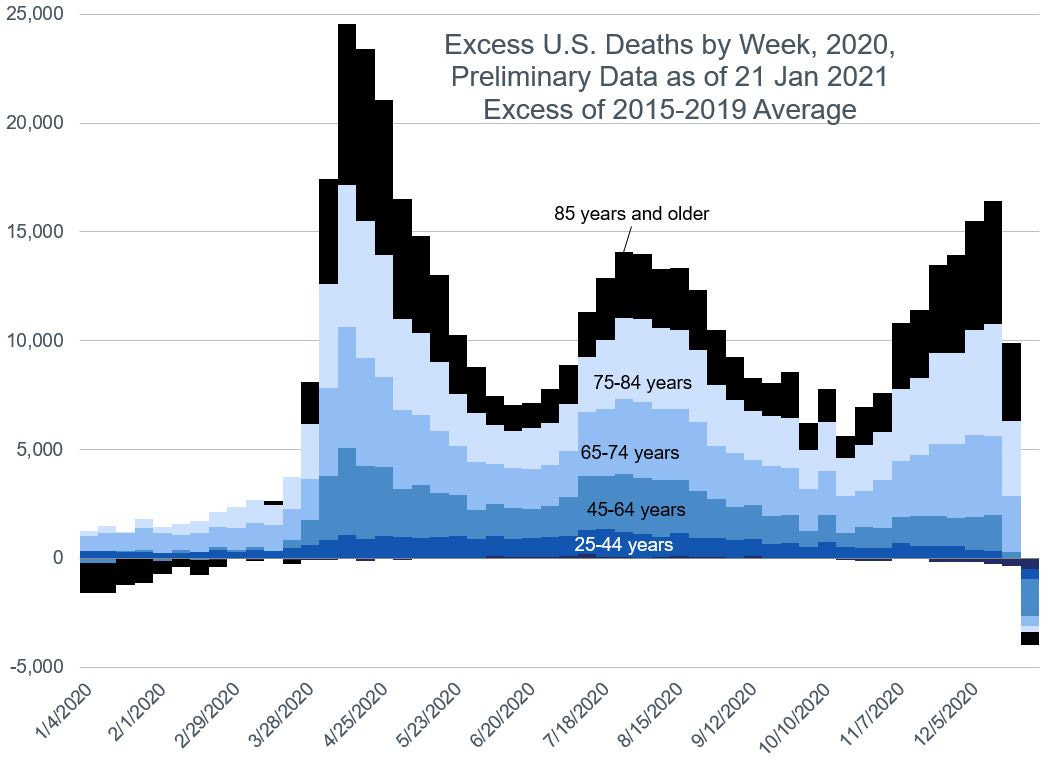
Author: Mary Pat Campbell
Publication Date: 26 January 2021
Publication Site: STUMP
Link: https://www.wsj.com/articles/covid-19-is-speeding-up-how-deaths-are-recorded-11611397800
Excerpt:
When governments realized death tolls were too low, they revamped the way they counted them
….
Weeks after the virus hit Italy last year, doctors, funeral homes and officials realized that government Covid-19 death tolls were too low and many victims weren’t getting included. Informal tallies quickly revealed that thousands of deaths most likely caused by the virus had been omitted. Limited testing left the number of infections unknown, and many people had died outside hospitals, which were the initial source of fatality figures.
Italy’s statistical agency, Istat, scrambled to assemble more reliable information, collecting data from towns and cities faster than ever before. In May, it revealed what people at the front lines had suspected: a 39% jump in nationwide deaths between Feb. 21 and March 31 compared with previous years.
“Normally, they [the data] would have arrived six months later,” said Istat President Gian Carlo Blangiardo in May. “We made an extraordinary effort.”
Author: Daniel Michaels
Publication Date: 23 January 2021
Publication Site: WSJ
Link: https://www.cdc.gov/nchs/covid19/covid-19-mortality-data-files.htm
Description: List of publicly available mortality data sets for the U.S. from the CDC, related to excess mortality starting in 2020 as well as COVID-specific mortality. A few data sets are updated on weekdays, but others are updated weekly on Wednesdays (usually). A few ad hoc data sets from specific dates are at the end.
Publication Frequency: Weekly for most data sets
Publication Site: CDC
Link: https://www.cdc.gov/nchs/nvss/vsrr/covid19/excess_deaths.htm
Description: Tableau dashboards from the CDC showing weekly updated data, with the following dashboards:
Weekly Excess Deaths
Excess deaths with and without COVID-19
Excess deaths with and without weighting
Number of Excess Deaths
Percent Excess Deaths
Weekly Number of Deaths by Age
Weekly Number of Deaths by Race/Ethnicity
Change in Number of Deaths by Race/Ethnicity
Weekly Number of Deaths by Cause Group
Weekly Number of Deaths by Cause Subgroup
Change in the Number of Deaths by Cause
Total number above average by cause
Total number above average by jurisdiction/cause
Also, downloadable data.
Example from 24 January 2021:
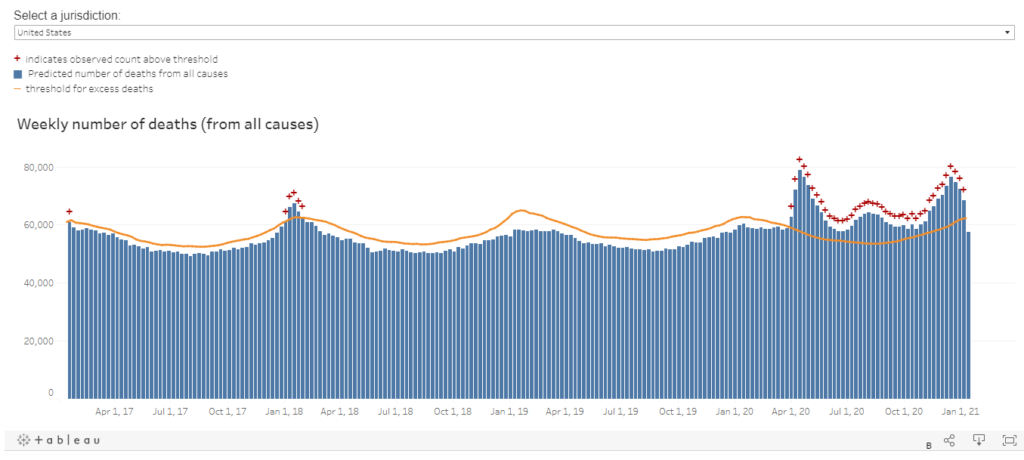
Data last updated: 21 January 2021
Regularly updated on Wednesdays, usually
Publication Site: CDC
Link: https://www.cdc.gov/nchs/nvss/vsrr/covid19/index.htm
Description: Weekday updates of total and COVID-mortality counts by state (New York City split out separately, Puerto Rico included.) Table 1 has counts of deaths involving COVID-19 and other select causes of death by time-period in which the death occurred. All data downloadable.
Last updated: 22 January 2021
Accessed: 24 January 2021
Publication site: CDC
Link: https://www.wsj.com/articles/covid-19-deaths-to-reverse-u-s-life-expectancy-gains-11608613261
Description: 2019 U.S. mortality experience had been released by the CDC, and comparing against likely experience from 2020.
Author: Janet Adamy
Publication Date: 22 December 2020
Publication Site: Wall Street Journal
Description: Digging into CDC total death data for age groups 25-44 and under age 25, entire United States and top ten states by population (plus New York City)
CDC interactive dashboards are here: https://www.cdc.gov/nchs/nvss/vsrr/covid19/excess_deaths.htm
I accessed the CDC site on 20 January 2021.
Publication date: 22 Jan 2021
Author: Mary Pat Campbell
Publication site: YouTube
Description: Digging into CDC total death data for age groups 45-64 and 65-74, entire United States and top ten states by population (plus New York City)
CDC interactive dashboards are here: https://www.cdc.gov/nchs/nvss/vsrr/covid19/excess_deaths.htm
I accessed the CDC site on 20 January 2021.
Publication date: 21 Jan 2021
Author: Mary Pat Campbell
Publication site: YouTube
Description: Digging into CDC total death data for age groups 75-84 and 85+, entire United States and top ten states by population (plus New York City)
CDC interactive dashboards are here: https://www.cdc.gov/nchs/nvss/vsrr/covid19/excess_deaths.htm
I accessed the CDC site on 20 January 2021.
Publication date: 20 Jan 2021
Author: Mary Pat Campbell
Publication site: YouTube