Link:https://www.spiked-online.com/2022/01/21/the-catastrophe-of-the-covid-models/
Graphic:

Excerpt:
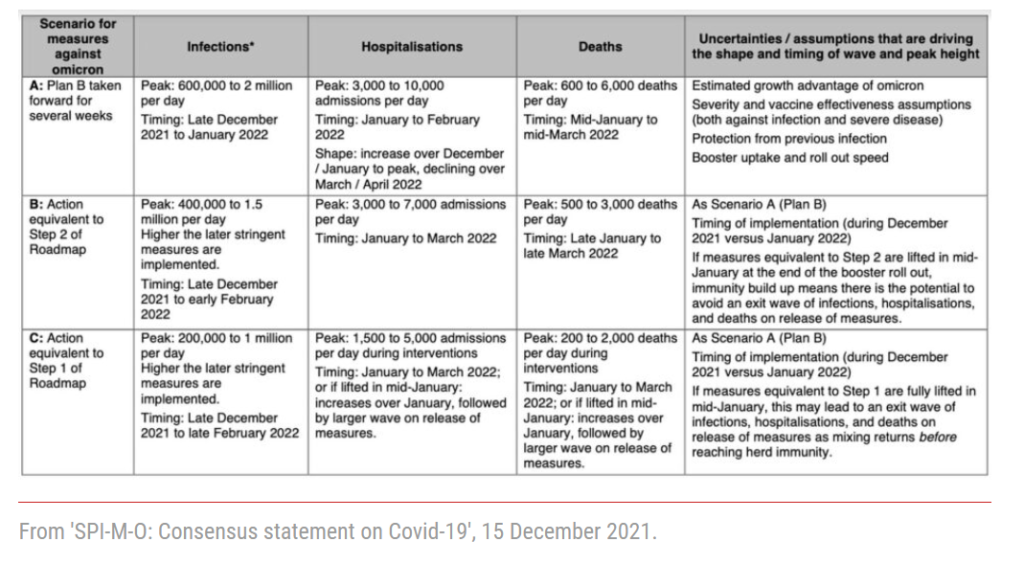
Having taken all the modelling into account, SAGE produced a table that showed in stark terms what the future held if the government stuck to ‘Plan B’. With the usual risible caveat that ‘these are not forecasts or predictions’, they showed a peak in hospitalisations of between 3,000 and 10,000 per day and a peak in deaths of between 600 and 6,000 a day. In previous waves, without any vaccines, deaths had never exceeded 1,250 a day.
The government was effectively given an ultimatum. SAGE offered Johnson a choice between the disaster that would surely unfold and a ‘Step 1’ or ‘Step 2’ lockdown, both of which had been helpfully modelled to give him a steer. ‘Step 1’ was a full lockdown as implemented last January. ‘Step 2’ allowed limited contact with other households but only outdoors.
In the event, as we all know, Boris Johnson ignored the warnings and declined to implement any new restrictions on liberty. A few days later, Robert West, a nicotine-addiction specialist who is on SAGE for some reason, tweeted: ‘It is now a near certainty that the UK will be seeing a hospitalisation rate that massively exceeds the capacity of the NHS. Many thousands of people have been condemned to death by the Conservative government.’
It did not quite turn out that way. Covid-related hospitalisations in England peaked at 2,370 on 29 December and it looks like the number of deaths will peak well below 300. This is not just less than was projected under ‘Plan B’, it is less than was projected under a ‘Step 2’ lockdown. The modelling for ‘Step 2’ showed a peak of at least 3,000 hospitalisations and 500 deaths a day. SAGE had given itself an enormous margin of error. There is an order of magnitude between 600 deaths a day and 6,000 deaths a day and yet it still managed to miss the mark.
Author(s): Christopher Snowdon
Publication Date: 22 Jan 2022
Publication Site: Spiked Online