Graphic:
Excerpt:
In this paper I use the 1973 cross-sectional Current Population Survey (CPS) matched to longitudinal Social Security administrative data (through 1998) to examine the relationship between retirement age and mortality for men who have lived to at least age 65 by year 1997 or earlier.1 Logistic regression results indicate that controlling for current age, year of birth, education, marital status in 1973, and race, men who retire early die sooner than men who retire at age 65 or older. A positive correlation between age of retirement and life expectancy may suggest that retirement age is correlated with health in the 1973 CPS; however, the 1973 CPS data do not provide the ability to test that hypothesis directly.
Regression results also indicate that the composition of the early retirement variable matters. I represent early retirees by four dummy variables representing age of entitlement to Social Security benefits—exactly age 62 to less than 62 years and 3 months (referred to as exactly age 62 in this paper), age 62 and 3 months to 62 and 11 months, age 63, and age 64. The reference variable is men taking benefits at age 65 or older. I find that men taking benefits at exactly age 62 have higher mortality risk than men taking benefits in any of the other four age groups. I also find that men taking benefits at age 62 and 3 months to 62 and 11 months, age 63, and age 64 have higher mortality risk than men taking benefits at age 65 or older. Estimates of mortality risk for “early” retirees are lowered when higher-risk age 62 retirees are combined with age 63 and age 64 retirees and when age 62 retirees are compared with a reference variable of age 63 and older retirees. Econometric models may benefit by classifying early retirees by single year of retirement age—or at least separating age 62 retirees from age 63 and age 64 retirees and age 63 and age 64 retirees from age 65 and older retirees—if single-year breakdowns are not possible.
The differential mortality literature clearly indicates that mortality risk is higher for low-educated males relative to high-educated males. If low-educated males tend to retire early in relatively greater numbers than high-educated males, higher mortality risk for such individuals due to low educational attainment would be added to the higher mortality risk I find for early retirees relative to that for normal retirees. Descriptive statistics for the 1973 CPS show that a greater proportion of age 65 retirees are college educated than age 62 retirees. In addition, a greater proportion of age 64 retirees are college educated than age 62 retirees, and a lesser proportion of age 64 retirees are college educated than age 65 or older retirees. Age 63 retirees are only slightly more educated than age 62 retirees.
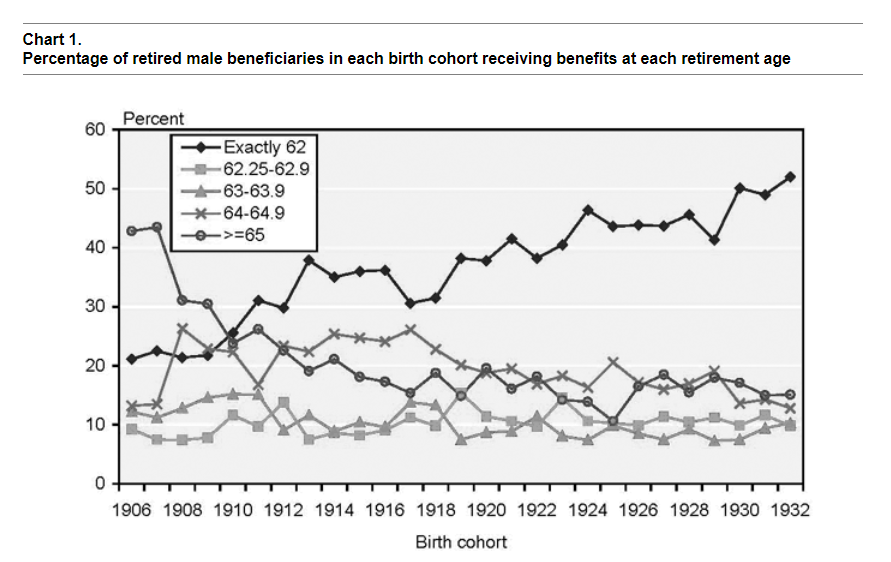
Despite a trend toward early retirement over the birth cohorts in the 1973 CPS, I do not find a change in retirement age differentials over time. However, I do find a change in mortality risk by education over time. Such a change may result from the changing proportion of individuals in each education category over time, a trend toward increasing mortality differentials by socioeconomic status, or a combination of the two.
This paper does not directly explore why a positive correlation between retirement age and survival probability exists. One possibility is that men who retire early are relatively less healthy than men who retire later and that these poorer health characteristics lead to earlier deaths. One can interpret this hypothesis with a “quasidisability” explanation and a benefit optimization explanation. Links between these interpretations and my analysis of the 1973 CPS are fairly speculative because I do not have the appropriate variables needed to test these interpretations.
A quasi-disability explanation, following Kingson (1982), Packard (1985), and Leonesio, Vaughan, and Wixon (2000), could be that a subgroup of workers who choose to take retired-worker benefits at age 62 is significantly less healthy than other workers but unable to qualify for disabled-worker benefits. An econometric model with a mix of both these borderline individuals and healthy individuals retiring at age 62 and with almost no borderline individuals retiring at age 65 could lead to a positive correlation between retirement and mortality, even if a greater percentage of individuals who retire at age 62 are healthy than unhealthy. Evidence for this hypothesis can be inferred from the finding that retiring at exactly age 62 increases the odds of dying in a unit age interval by 12 percent relative to men retiring at 62 and 3 months to 62 and 11 months for men in the 1973 CPS. In addition, retiring exactly at age 62 increases the odds of dying by 23 percent relative to men retiring at age 63 and by 24 percent relative to men retiring at age 64. A group with relatively severe health problems waiting for their 62nd birthday to take benefits could create this result.
An explanation based on benefit optimization follows Hurd and McGarry’s research (1995, 1997) in which they find that individuals’ subjective survival probabilities roughly predict actual survival. If men in the 1973 CPS choose age of benefit receipt based on expectations of their own life expectancy, then perhaps a positive correlation between age of retirement and life expectancy implies that their expectations are correct on average. If actuarial reductions for retirement before the normal retirement age are linked to average life expectancy and an individual’s life expectancy is below average, it may be rational for that individual to retire before the normal retirement age. Evidence for this hypothesis can be inferred from the fact that men retiring at age 62 and 3 months to age 62 and 11 months, age 63, and age 64 all experience greater mortality risk than men retiring at age 65 or older. If only men with severe health problems who are unable to qualify for disability benefits are driving the results, we probably would not expect to see this result. We might expect most of these individuals to retire at the earliest opportunity (exactly age 62).2
Author(s): Hilary Waldron
Publication Date: August 2001
Publication Site: Social Security Office of Policy, ORES Working Paper No 93