Link: https://www.macs.hw.ac.uk/~andrewc/papers/JRSS2016B.pdf
Graphic:
Summary:
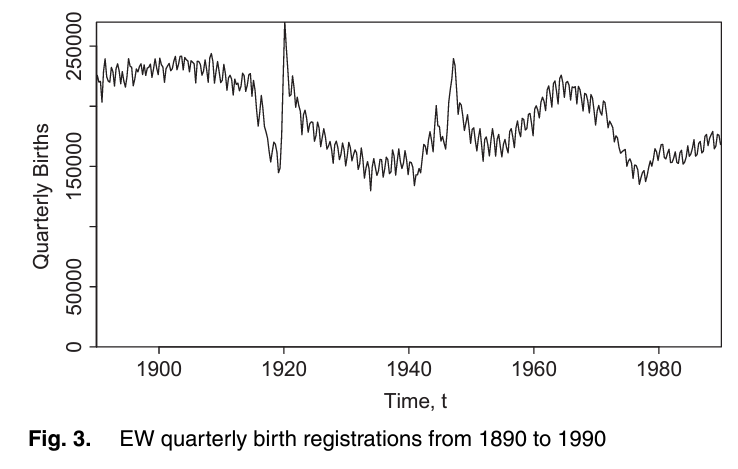
The analysis of national mortality trends is critically dependent on the quality of the population, exposures and deaths data that underpin death rates. We develop a framework that allows us to assess data reliability and to identify anomalies, illustrated, by way of example, using England and Wales population data. First, we propose a set of graphical diagnostics that help to pinpoint anomalies. Second, we develop a simple Bayesian model that allows us to quantify objectively the size of any anomalies. Two-dimensional graphical diagnostics and modelling techniques are shown to improve significantly our ability to identify and quantify anomalies. An important conclusion is that significant anomalies in population data can often be linked to uneven patterns of births of people in cohorts born in the distant past. In the case of England and Wales, errors of more than 9% in the estimated size of some birth cohorts can be attributed to an uneven pattern of births. We propose methods that can use births data to improve estimates of the underlying population exposures. Finally, we consider the effect of anomalies on mortality forecasts and annuity values, and we find significant effects for some cohorts. Our methodology has general applicability to other sources of population data, such as the Human Mortality Database.
Keywords: Baby boom;Cohort–births–deaths exposures methodology; Convexity adjustment ratio; Deaths; Graphical diagnostics; Population data
Author(s): Andrew J.G.Cairns, Heriot-Watt University, Edinburgh, UK David Blake, Cass Business School, London, UK Kevin Dowd Durham University Business School, UK and Amy R. Kessler Prudential Retirement, Newark, USA
Publication Date: 2016
Publication Site: Journal of the Royal Statistical Society
J. R. Statist. Soc. A (2016) 179, Part 4, pp. 975–1005