Link: https://www.forbes.com/sites/ebauer/2022/09/02/two-key-takeaways-from-the-new-cdc-life-expectancy-data/?sh=6ce149f31cfc
Excerpt:
To what extent, are these drops of life expectancy due to Covid-19, rather than other causes?
From 2019 to 2020, the CDC reports that 90% of the drop in Hispanic life expectancy was attributable to Covid; the corresponding rates were 68% for whites and 59% for blacks. (No breakdown was provided for the AIAN or Asian categories.) However, the CDC data splits its breakdowns into “contributions to decreases” and “contributions to increases” rather than overall net effect. Those readers who are used to looking at data and charts will expect a “waterfall” style chart; the CDC version is not this, and is not particularly helpful.
In any event, relative to the 2020 baseline, the further decreases in life expectancy during 2021 had multiple causes. Only among the White demographic group was Covid the cause of over half of the decline; unintentional injury (including overdoses) was the second-largest contributing factor and for the AIAN demographic group, worsening rates of death due to chronic liver disease and cirrhosis played almost as substantial a role.
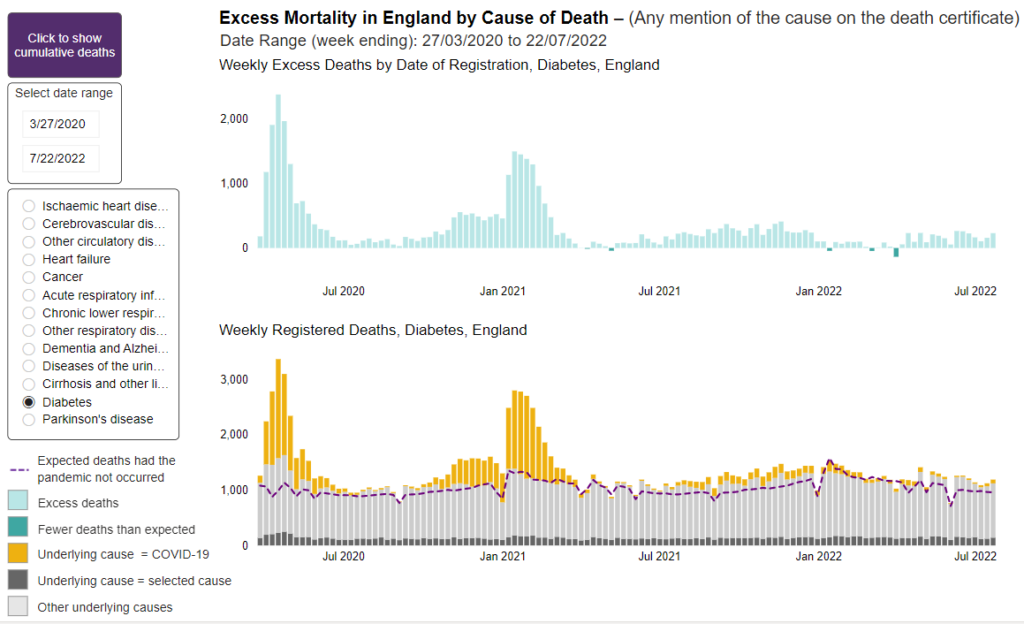
And, finally, it is important to understand that the CDC data shows a continued improvement in life expectancy due to reductions in death due to such causes as influenza/pneumonia, COPD/emphysema, Alzheimer disease, diabetes, and perinatal conditions (infant deaths). In fact, strikingly, in 2021, heart disease was a contributor to increased life expectancy in the Black, Hispanic, and Asian demographic groups, but a contributor to decreased life expectancy for the White and AIAN groups.
Again, though, the way the CDC provides its information means that, when it comes down to it, there is much that is simply missing; we do not know the magnitude of the improvements in life expectancy due to these causes, just that it exists. It even seems likely, or at least possible, that some of the apparent improvement in mortality due to these factors was actually because deaths were actually recorded as Covid deaths instead (whether due to multiple causes of death or other reasons).
Author(s): Elizabeth Bauer
Publication Date: 2 Sept 2022
Publication Site: Forbes