Insurance Companies and the Growth of Corporate Loan Securitization

Link:https://libertystreeteconomics.newyorkfed.org/2021/10/insurance-companies-and-the-growth-of-corporate-loan-securitization/

Graphic:

Excerpt:

The rating-based mapping was partially altered in 2010, when the NAIC enacted a regulatory change that essentially allowed insurance companies to report CLO tranches that were purchased at a discount, or highly impaired, in a lower NAIC category than that implied by the rating-based mapping. The new capital regime for CLO investments likely increased insurance companies’ incentives to invest in higher-yielding CLO tranches.

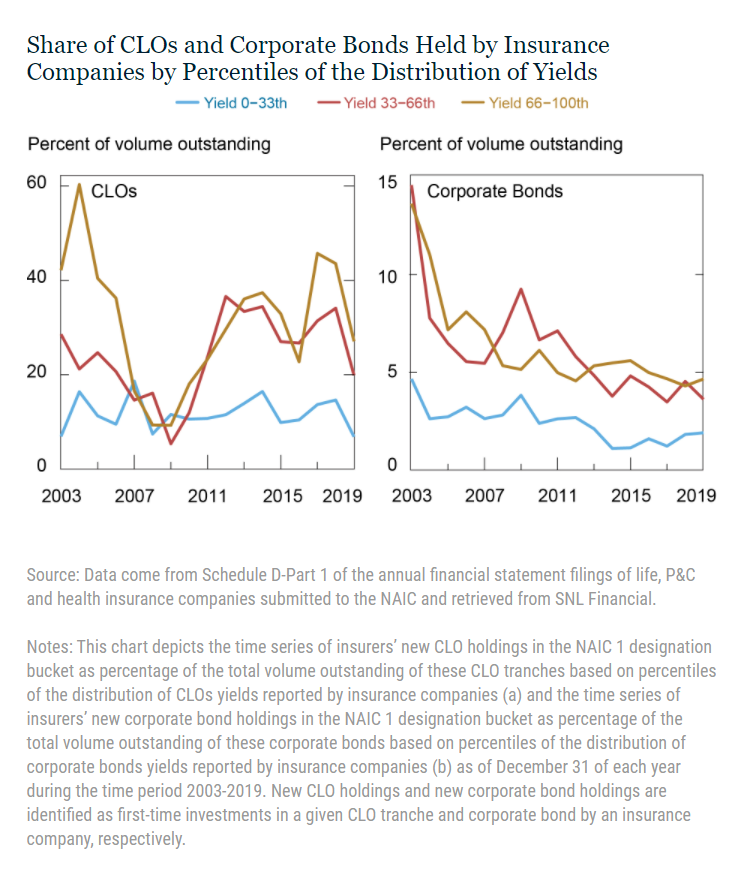
The following chart presents some evidence consistent with reach-for-yield behavior, particularly since the regulatory reforms of 2010. The left panel shows the time series of insurers’ new CLO holdings falling into the NAIC 1 designation as a percentage of the total volume outstanding of these tranches based on percentiles of the distribution of CLOs yields for each year. As expected, there is a clear preference for the riskiest tranches within NAIC 1 (those with yields above the 66th percentile) throughout the sample period, with the exception of the financial crisis, when all yields are squeezed at their minimum levels. Interestingly, the market shares of CLO tranches with yields above the 33rd percentile experience a sharp increase in the two years following the 2010 regulatory reform, then register a significant drop in 2019, when the reform was repealed. We do not find similar evidence in insurance companies’ corporate bond investments (right panel).

Author(s): Fulvia Fringuellotti, João A. C. Santos

Publication Date: 13 Oct 2021

Publication Site: Federal Reserve Bank of New York

QUARTERLY REPORT ON HOUSEHOLD DEBT AND CREDIT: 2021Q2

Link: https://www.newyorkfed.org/medialibrary/interactives/householdcredit/data/pdf/HHDC_2021Q2.pdf

Graphic:

Excerpt:

Aggregate household debt balances increased by $313 billion in the second quarter of 2021, a 2.1% rise from 2021Q1, and
now stand at $14.96 trillion. Balances are $812 billion higher than at the end of 2019 and $691 billion higher than 2020Q2. The 2.1%
increase in aggregate balances was the largest seen since 2013Q4 and marked the largest nominal increase in debt balances since
2007Q2.

Publication Date: August 2021

Publication Site: NY Fed

HOUSEHOLD DEBT AND CREDIT REPORT (Q2 2021)

Link: https://www.newyorkfed.org/microeconomics/hhdc.html

Graphic:

Excerpt:

Total Household Debt Climbs Boosted by Growth in Mortgages and Auto Loans

According to the latest Quarterly Report on Household Debt and Credit, total household debt rose by $313 billion (2.1 percent) to reach $14.96 trillion in the second quarter of 2021. Mortgage balances—the largest component of household debt—rose by $282 billion and auto loans increased by $33 billion. Credit card balances ticked up by $17 billion while student loan debt decreased by $14 billion. Mortgage originations, which include mortgage refinances, reached $1.2 trillion, surpassing the volumes seen in the preceding three quarters. Auto loan originations, which include both loans and leases, reached a record $202 billion.

Publication Date: Accessed 22 Sept 2021

Publication Site: NY Fed

September 19-25, 1921

Link: https://roaring20s.substack.com/p/september-19-1921

Graphic:

Excerpt:

The Federal Reserve of New York lowers rates from 5.5% to 5% on September 21. The rest of the Fed branches match in tandem. The powerful New York Federal Reserve President (Governor pre-1935), Benjamin Strong, delivers a terse statement to the Journal. Equities seem nonplussed and drop the next day. The aggregate yield on high quality debt rallies from 4.8% to 4.5%.

Author(s): Tate

Publication Date: 19 Sept 2021

Publication Site: Roaring 20s at substack

Covid Housing Boom Is Even Bigger Than Imagined

Link: https://www.bloomberg.com/opinion/articles/2021-02-17/covid-housing-boom-is-even-bigger-than-imagined

Graphic:

Excerpt:

The Federal Reserve Bank of New York on Wednesday released its quarterly report on household debt and credit for the final three months of 2020, with its strategists and statisticians deciding to dig deeper into mortgage originations, the types of homebuyers during the Covid-19 pandemic and to what extent Americans are taking out cash against their home equity. While much of what they found confirms many of the narratives about the housing market, it’s the sheer magnitude of the move that’s breathtaking and puts into context where the economy stands almost one year after the coronavirus crisis began in the U.S.

At the highest level, mortgage originations reached almost $1.2 trillion in the final three months of 2020, the highest quarterly volume in the history of the New York Fed’s data, which begins in 2000. Americans refinanced more mortgage debt last year than any time since 2003, while mortgages taken out to purchase a home surged to the highest since 2006. First-time buyers took on more debt than at any time in history, while mortgages for repeat buyers and those looking for a second home or an investment property reached the highest in more than a decade.

Meanwhile, home prices soared across the U.S., with the S&P CoreLogic Case-Shiller index jumping 9.5% in November, the most since 2014 (December’s figures will be released next week). This surge led to “a notable increase in cashout refinance volumes, which spiked in the fourth quarter of 2020 and show no sign of abating,” the New York Fed researchers said in a blog post. Collectively, homeowners withdrew $182 billion in home equity in 2020, or an average of about $27,000 for each household. Even those who chose not to take out extra cash saved an average of $200 a month on their mortgage payments.

Author(s): Brian Chappatta

Publication Date: 17 February 2021

Publication Site: Bloomberg