Skip to content

Actuarial News

All about risk

  • Public Pensions
  • Mortality
  • Public Finance
  • Investments

Tag: General Account

Another Year of Double-Digit Growth in U.S. Insurers’ Bank Loan Exposure in 2022

July 13, 2023July 13, 2023 Mary Pat Campbell

Link: https://content.naic.org/sites/default/files/capital-markets-special-reports-bankloans-ye2022.pdf

Graphic:

Executive Summary:

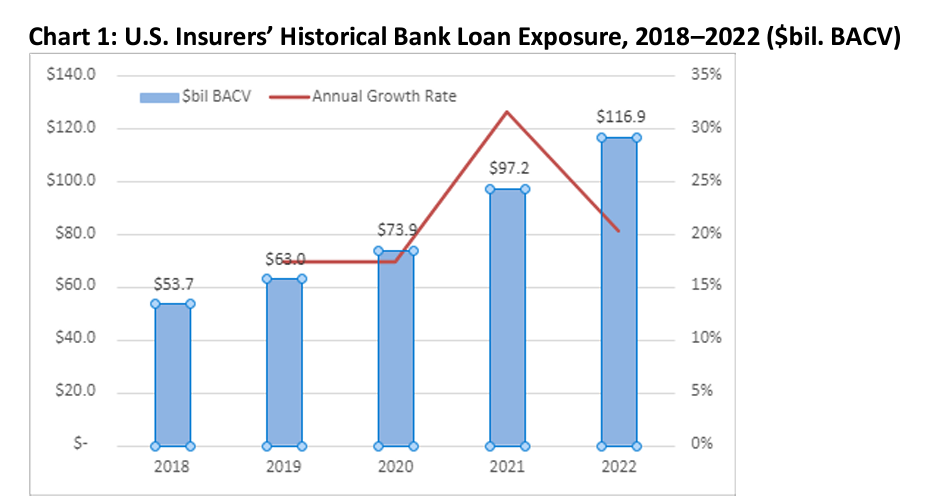
Bank loans were one of the fastest-growing asset types in 2022 for U.S. insurers, increasing by 21% to $117 billion in book/adjusted carrying value (BACV) from $97.2 billion in 2021.

Despite the double-digit growth, bank loans were under 2% of U.S. insurers’ total cash and invested assets at year-end 2022, and about 75% were acquired in market transactions; the remaining 25% were issued by the reporting entities.

Large life companies, or those with more than $10 billion in assets under management, accounted for almost 80% of U.S. insurers’ bank loan exposure, up from 74% in 2021; the top 10 insurance companies accounted for 60% of U.S. insurers’ total bank loan exposure at year-end 2022, up from 54% in 2021.

There was continued improvement in credit quality for U.S. insurer bank loans, evidenced in part by a decrease in those carrying NAIC 4 Designations—i.e., implying a B credit rating—to 26% of total bank loans in 2022 from 33% in 2021, and countered by an increase in bank loans carrying NAIC 1 Designations to 24% in 2022 from 18% in 2021.

Total U.S. leveraged bank loan volume was about $1.7 trillion in 2022, representing a 2% increase from 2021.

Author(s): Jennifer Johnson

Publication Date: 11 July 2023

Publication Site: NAIC Capital Markets Bureau

U.S. Insurance Industry’s Exposure to Schedule BA Assets Exceeds $500 Billion in 2021

June 3, 2022June 3, 2022 Mary Pat Campbell

Link: https://content.naic.org/sites/default/files/capital-markets-special-reports-Sch-BA-YE2021.pdf

Graphic:

Excerpt:

The U.S. insurance industry’s reported BACV of $522.8 billion in other long-term invested assets on
Schedule BA represented an increase of 14.8% at year-end 2021 compared to year-end 2020 (see Table
1 and Table 2). Schedule BA assets have experienced strong double-digit growth in recent years, with
2021’s 15% increase in exposure following YOY growth of 13% and 10% in 2020 and 2019, respectively.
Total Schedule BA exposure as of year-end 2021 represented 6.5% of the industry’s total cash and
invested assets, an increase from 6.1% as of year-end 2020 and 5% as of year-end 2012.

Like previous years, hedge fund, private equity, and real estate investments represented most of the
industry’s Schedule BA exposure. Together, they accounted for 75% of total exposure at year-end 2021
compared to 70% at year-end 2020. Exposure to private equity investments experienced significant
growth, increasing by 34% YOY to $173 billion as of year-end 2021. Private equity’s share of total
Schedule BA exposure rose to 33% from 28% at year-end 2020, surpassing hedge fund investments to
become the largest component of the industry’s exposure.

Author(s): Michele Wong and Jean-Baptiste Carelus

Publication Date: 3 June 2022

Publication Site: NAIC Capital Markets Special Report

Categories

  • admin(1)
  • Annuities(13)
  • Auto(64)
  • Catastrophe(13)
  • Climate(96)
  • Credit risk(100)
  • Cyber Risk(18)
  • Data science(109)
  • Data visualization(130)
  • Demographics(275)
  • Economic(882)
  • Employee benefits(42)
  • Exams(4)
  • General actuarial(78)
  • General career(11)
  • General mathematics(8)
  • Healthcare(379)
  • Homeowners(9)
  • Insurance(90)
  • Investments(530)
  • Liability(24)
  • Losses(31)
  • Morbidity(506)
  • Mortality(701)
  • Multiemployer pensions(104)
  • Operational Risk(162)
  • Property Insurance(32)
  • Public Finance(698)
  • Public Pensions(638)
  • Regulation(828)
  • Retirement(204)
  • Risk(96)
  • Risk Management(72)
  • Social Security(100)
  • Technology(79)
  • Uncategorized(1)
  • Workers Compensation(10)

Actuarial Books at Amazon

Actuarial Books

Archives

About

  • About Actuarial News

Topics

2020 (68) ai-CIO (102) American Rescue Plan Act of 2021 (94) Andrew Cuomo (57) bailout (79) Bloomberg (58) burypensions (75) California (82) CDC (141) Chicago (66) contributions (87) COVID (645) ESG (108) excess mortality (148) Federal Reserve (97) Forbes (65) Illinois (189) inflation (81) interest rates (354) inversion (278) Joe Biden (96) John Bury (76) life expectancy (64) Mary Pat Campbell (78) New Jersey (58) New York (119) nursing homes (74) pandemic (147) private equity (69) race/ethnicity (105) Reason (77) reform (62) retirement age (58) state taxes (66) STUMP (70) substack (85) Think Advisor (89) Treasury Department (328) unfunded liability (63) United Kingdom (68) United States (95) vaccination (131) vaccine (90) WSJ (224) yield curve (297)
Proudly powered by WordPress | Theme: Libre by Automattic.