Link: https://policyviz.com/2021/03/02/three-things-you-can-do-to-make-your-data-tables-more-visual/
Graphic:
Excerpt:
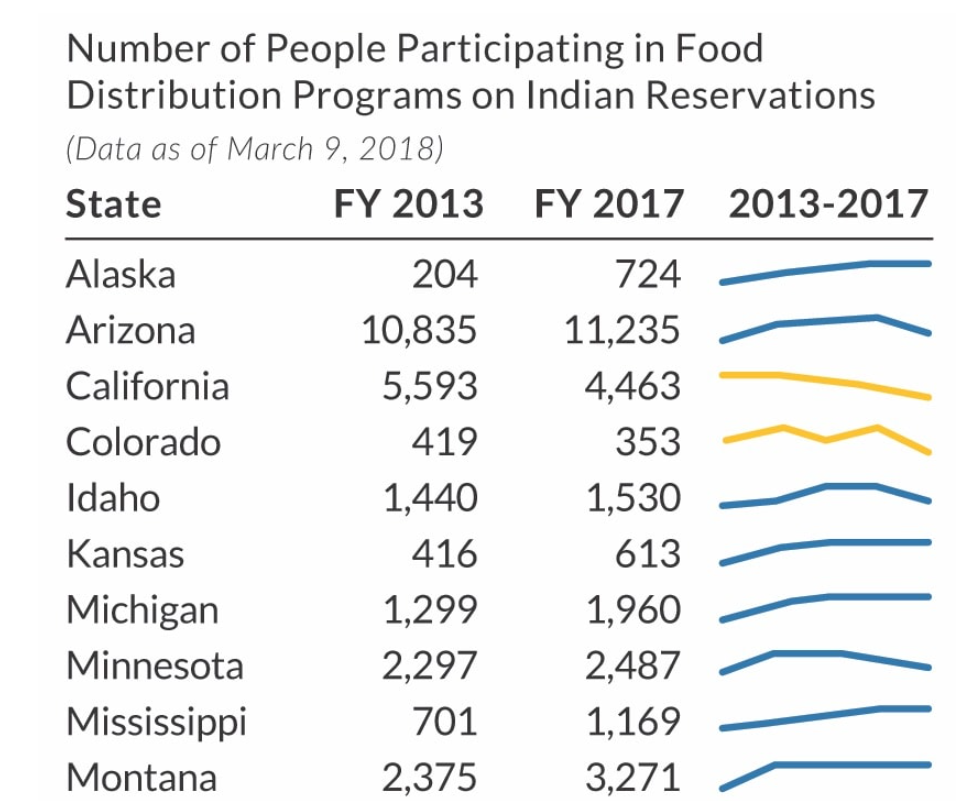
One last option is to add sparklines. Sparklines are small line charts that are typically used in data-rich tables, often at the end of a row or column. The purpose of sparklines is not necessarily to help the reader find specific values but instead to show general patterns and trends. Here, the sparklines show all five years of data, which allows us to omit three columns of numbers, lightening and simplifying the table. This approach lets us show the full time series in the sparklines while just showing the two endpoints in the table cells.
Author(s): Jon Schwabish
Publication Date: 2 March 2021
Publication Site: PolicyViz