Child Mortality Rate, under age five – doc v11

Link: https://www.gapminder.org/data/documentation/gd005/

Graphic:

Excerpt:

Documentation — version 11

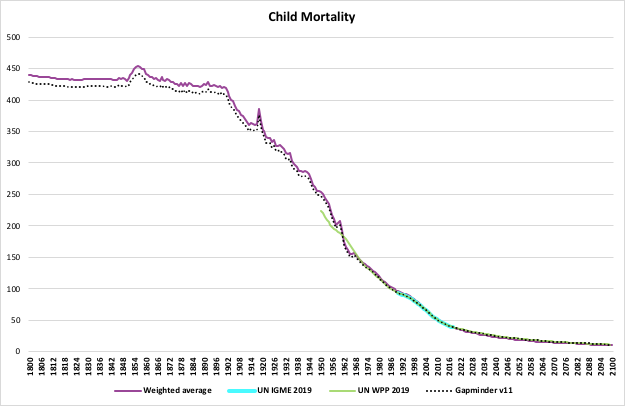
This page describes how Gapminder has combined data from multiple sources into one long coherent dataset with Child mortality under age 5, for all countries for all years between 1800 to 2100.

Data » Online spreadsheet with data for countries, regions and global total — v11

SUMMARY DOCUMENTATION OF V11

Sources

— 1800 to 1950: Gapminder v7  (In some cases this is also used for years after 1950, see below.) This was compiled and documented by Klara Johansson and Mattias Lindgren from many sources but mainly based on www.mortality.org and the series of books called International Historical Statistics by Brian R Mitchell, which often have historic estimates of Infant mortality rate which were converted to Child mortality through regression. See detailed documentation of v7 below.

— 1950 to 2016: UNIGME, is a data collaboration project between UNICEF, WHO, UN Population Division and the World Bank. They released new estimates of child mortality for countries and a global estimate on September 19, 2019, and the data is available at www.childmortality.org. In this dataset, 70% of all countries have estimates between 1970 and 2018, while roughly half the countries also reach back to 1960 and 17% reach back to 1950.

— 1950 to 2100: UN POPWorld Population Prospects 2019 provides annual data for Child mortality rate for all countries in the annually interpolated demographic indicators, called WPP2019_INT_F01_ANNUAL_DEMOGRAPHIC_INDICATORS.xlsx, accessed on January 12, 2020.

Publication Date: accessed 22 March 2023

Publication Site: Gapminder

The pandemic’s reported death toll will soon reach 1 million people in the United States.

Link: https://www.washingtonpost.com/opinions/interactive/2022/how-many-people-died-covid-united-states-1-million-graphic/

Graphic:

Excerpt:

The pandemic’s death toll in the United States will surpass 1 million people in the coming days. Conveying the meaning or the magnitude of this number is impossible. But 1 million deaths is the benchmark of an unprecedented American tragedy.

Consider this comparison: The population of D.C. is about 670,000 people. Try to imagine life without every person, in every building, on every street, in the nation’s capital. And then imagine another 330,000 people are gone.

To attempt to put the 1 million deaths in context, we plotted its damage over more than two years and compared the continuing death toll with the tolls from previous catastrophes in our history.

Author(s): Sergio Peçanha and Yan Wu

Publication Date: 12 May 2022

Publication Site: Washington Post

HOW TO BELIEVE IN ASTROLOGY

Link:https://www.firstthings.com/article/2021/10/how-to-believe-in-astrology

Excerpt:

Until the eighteenth century, the London Bills of Mortality would frequently list a cause of death as “planet.” This meant that a man had died without apparent cause, but the reason was clear. He had fallen under the influence of an evil star. A planet had killed this man, as directly as if a trillion tons of livid space-rock had come screaming out of the sky to conk him on the head. This is what it means to believe in astrology: accepting that at any moment, the mathematically preordained rhythms of the heavens might simply decide to kill you.

Author(s): Sam Kriss

Publication Date: October 2021

Publication Site: First Things

Edmond Halley’s Life Table and Its Uses

Link: https://fac.comtech.depaul.edu/jciecka/Halley.pdf

Formal citation: James E. Ciecka. 2008. Edmond Halley’s Life Table and Its Uses. Journal of Legal
Economics
15(1): pp. 65-74.

Graphic:

Excerpt:

Halley obtained demographic data for Breslau, a city in Silesia which is now the Polish city Wroclaw. Breslau kept detailed records of births, deaths, and the ages of people when they died. In comparison, when John Graunt (1620-1674) published his famous demographic work (1662), ages of deceased people were not recorded in London and would not be recorded until the 18th century.


Caspar Neumann, an important German minister in Breslau, sent some demographic records to Gottfried Leibniz who in turn sent them to the Royal Society in London. Halley analyzed Newmann’s data which covered the years 1687-1691 and published the analysis in the Philosophical Transactions. Although Halley had broad interests, demography and actuarial science were quite far afield from his main areas of study. Hald (2003) has speculated that Halley himself analyzed these data because, as the editor of the Philosophical Transactions, he
was concerned about the Transactions publishing an adequate number of quality papers. 2 Apparently, by doing the work himself, he ensured that one more high quality paper would be published.

Author(s): James E. Ciecka

Publication Date: 2008 [accessed June 2021]

Publication Site: DePaul University

The smallest population increase in 15 years

Link: https://www.scb.se/hitta-statistik/statistik-efter-amne/befolkning/befolkningens-sammansattning/befolkningsstatistik/pong/statistiknyhet/befolkningsstatistik-helaret-2020/

Graphic:

[kvinnor = women, man = men]

Excerpt: [via Google Translate]

Last year, it was especially in older ages that the number of deaths was more than in the immediately preceding years. The increasing number of deaths also affected men to a greater extent than women. The excess mortality rate last year was greatest among men older than 75 years, in the age group 75–84 years 20.6 per cent died more than during the comparison period. Among younger women 0-34 years, there was no excess mortality, -8.9 percent fewer died compared with the comparison period. For women, just like men, the differences were greatest in the oldest age groups; in the group aged 75–84, 14.7 per cent more deaths were noted than the average over the past five years.

It is not easy to put the number of dead in a longer historical context. Not least because the demographic composition and population of the country has changed. The development of the number of deaths over time is affected partly by the medical development and partly by the development of various diseases and lifestyles. The number of deaths during different periods is also affected by how many are at the ages when most people die.

Publication Date: 22 February 2021

Publication Site: Statistics Sweden