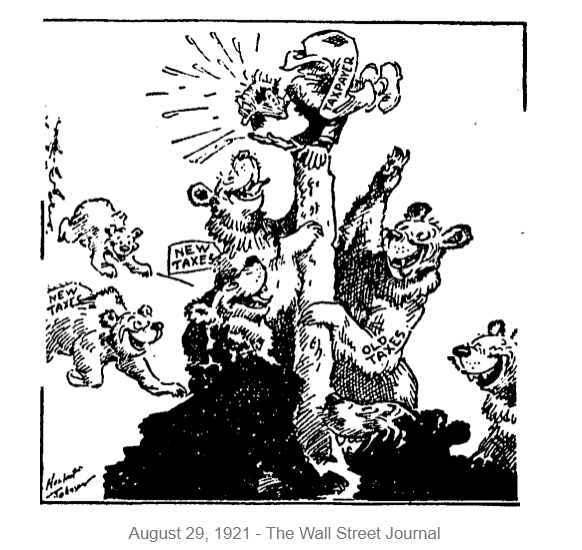
Pundits, observers, and investors believe the 1920s will be a slow growth decade. High taxes, heavy regulations, wage pressures are the main culprits. (Author note: the consensus in 1921 was incredibly bearish and incorrectly predicted a slow growth decade; the polar opposite consensus circulates today) This editorial cartoon sums up the mood in 1921:
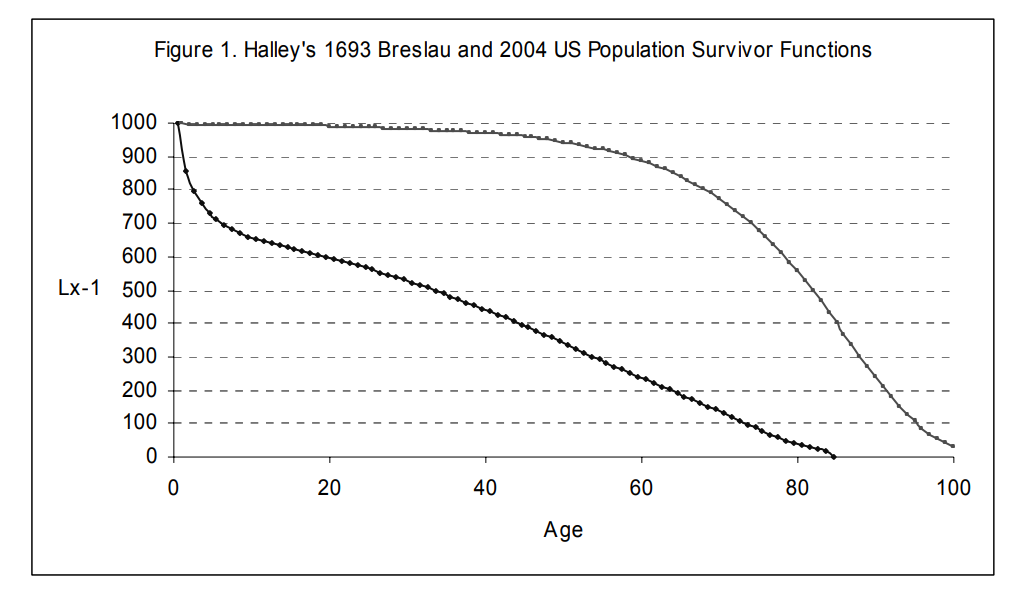
Formal citation: James E. Ciecka. 2008. Edmond Halley’s Life Table and Its Uses. Journal of Legal Economics 15(1): pp. 65-74.
Graphic:
Excerpt:
Halley obtained demographic data for Breslau, a city in Silesia which is now the Polish city Wroclaw. Breslau kept detailed records of births, deaths, and the ages of people when they died. In comparison, when John Graunt (1620-1674) published his famous demographic work (1662), ages of deceased people were not recorded in London and would not be recorded until the 18th century.
Caspar Neumann, an important German minister in Breslau, sent some demographic records to Gottfried Leibniz who in turn sent them to the Royal Society in London. Halley analyzed Newmann’s data which covered the years 1687-1691 and published the analysis in the Philosophical Transactions. Although Halley had broad interests, demography and actuarial science were quite far afield from his main areas of study. Hald (2003) has speculated that Halley himself analyzed these data because, as the editor of the Philosophical Transactions, he was concerned about the Transactions publishing an adequate number of quality papers. 2 Apparently, by doing the work himself, he ensured that one more high quality paper would be published.
In the ’70s, these overpopulation alarms had widespread impact. A 1970 survey found that 69 percent of married women in America agreed that US overpopulation was a “serious problem” — and that many of them were lowering the number of children they intended to have.
Now, however, the birthrate in the industrial world is below the “replacement rate” of 2.1 children per woman. That rate is set at the number of children needed to replace every parent, with more added to account for mortality.
In 1855, white American women averaged 5.31 births — well above the then-current replacement rate of 3.32 (higher then because of higher infant mortality). By 1980, the figure had dropped to 1.75 children each — well below the 2.1 replacement rate. Even the high birthrate of US Hispanics — 56 percent more than non-Hispanics in 1982 — doesn’t raise the total US rate above replacement levels.
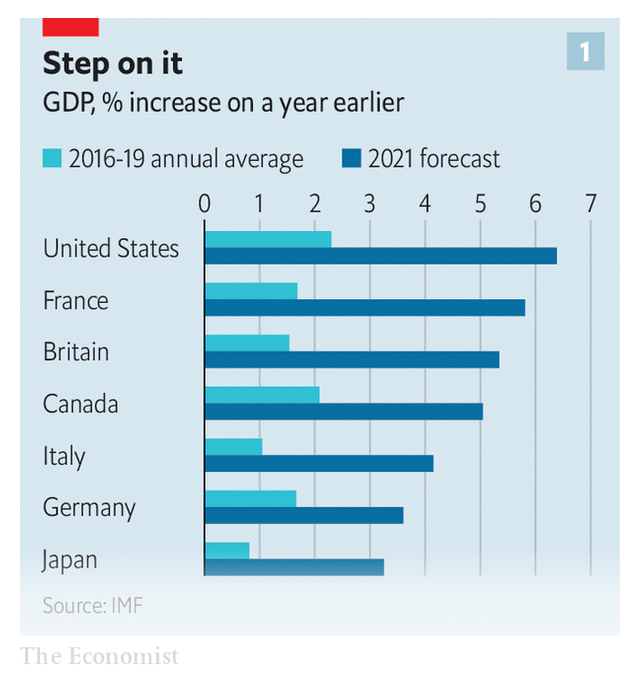
The record suggests that, after periods of massive non-financial disruption such as wars and pandemics, GDP does bounce back. It offers three further lessons. First, while people are keen to go out and spend, uncertainty lingers. Second, crises encourage people and businesses to try new ways of doing things, upending the structure of the economy. Third, as “Les Miserables” shows, political upheaval often follows, with unpredictable economic consequences.
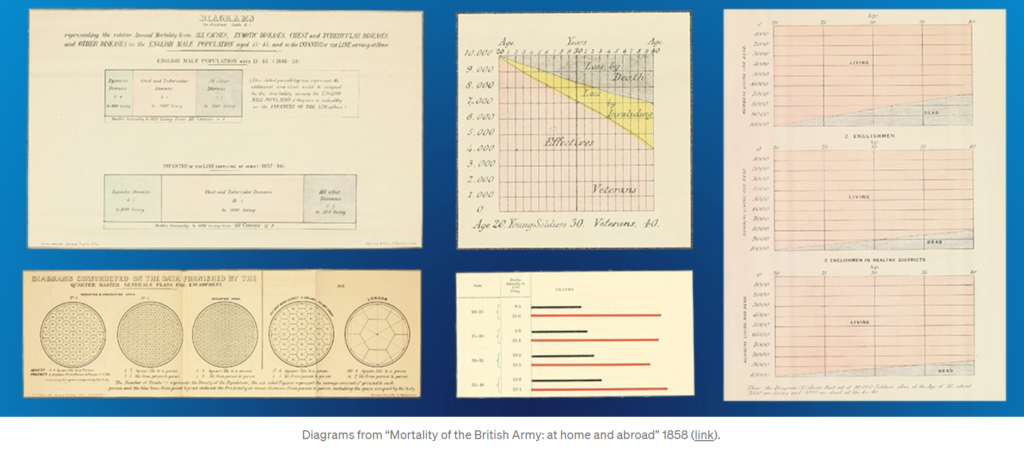
On trips through Europe, Nightingale displayed a natural inclination to record data: distance and times traveled were neatly cataloged in her journal. She hoarded information pamphlets, especially those concerning laws, social conditions, and benevolent institutions. In a Parisian salon, Mary Clarke showed Nightingale how bold, independent, intelligent, and equal to men a woman can be.
In Egypt, Nightingale cruised the Nile and discovered ancient mysticism. Near Thebes, God called Florence Nightingale to nursing. God called me in the morning and asked me would I do good for him alone without reputation. But rich kids do not become nurses. Nursing was below Nightingale’s class. Her family disapproved.
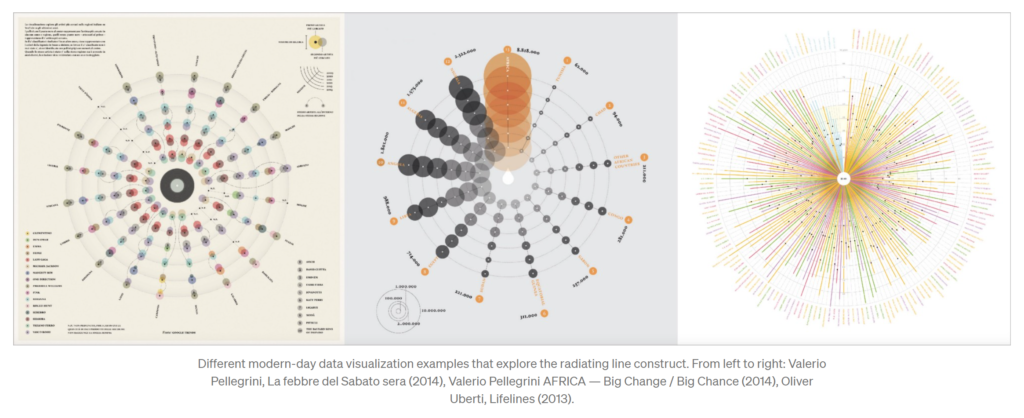
We might think of the pie chart as a fairly recent invention, with arguably more flaws than benefits, in regards to the statistical portrayal of data. However, if we look deep into history we realize this popular chart is only a recent manifestation of an ancient visual motif that carried meaning to numerous civilizations over space and time. A graphical construct of radiating lines enclosed by a circle, this motif is also a powerful perceptual recipe. If we look deep into ourselves we uncover a strong proclivity for such a visual pattern, despite the final message it might carry. As one of the oldest archetypes of the circular diagram, the sectioned circle will certainly outlast all of us, and indifferent to criticism, I suspect, so will the pie chart.
Excel may be the most influential software ever built. It is a canonical example of Steve Job’s bicycle of the mind, endowing its users with computational superpowers normally reserved for professional software engineers. Armed with those superpowers, users can create fully functional software programs in the form of a humble spreadsheet to solve problems in a seemingly limitless number of domains. These programs often serve as high-fidelity prototypes of domain specific applications just begging to be brought to market in a more polished form.
If you want to see the future of B2B software, look at what Excel users are hacking together in spreadsheets today. Excel’s success has inspired the creation of software whose combined enterprise value dwarfs that of Excel alone.
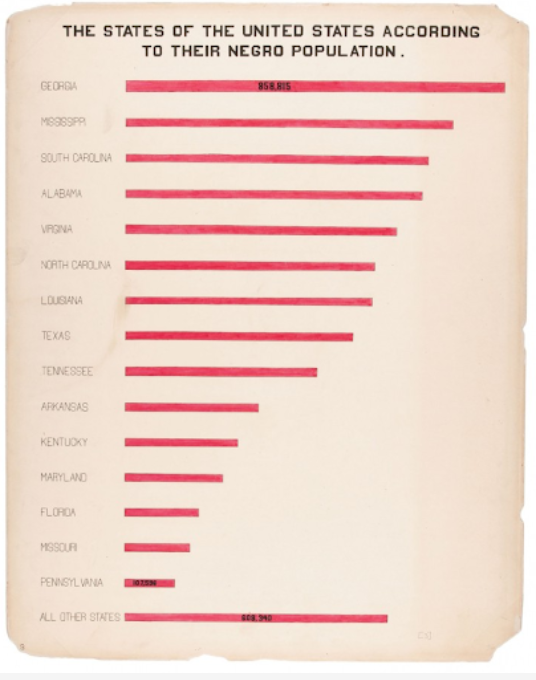
Du Bois was a professor of history, sociology and economics at Atlanta University. He established a sociology program in 1897, now recognized as the first school of American sociology. It was here that he led a team of students to produce 60 full-color charts, graphs, maps and tables on what had changed for African Americans since slavery. This collection was generated from a mix of existing records and empirical data collected by his sociological laboratory. The visualizations stressed one narrative; that the African American community had made progress. The colorful, hand-drawn illustrations showed that literacy rates for African Americans were rising and that African American ownership of property and land was increasing. African American businesses were growing and so were the number of patents for inventions.