Link: http://lenkiefer.com/2021/02/26/data-visualization-guidelines-and-a-case-study/
Graphic:
Excerpt:
Yesterday I gave a virtual lecture on data visualization at GMU. Here I’m posting the slides I used for that talk and including my discussion notes for the portion of the talk where I discussed guidelines for data visualization.
At the beginning of the talk I spoke a bit about data visualization guidelines. I framed this part of my talk around Jon Schwabish’s five guidelines from his new book Better Data Visualizations see (on Amazon) and here for a blog summary.
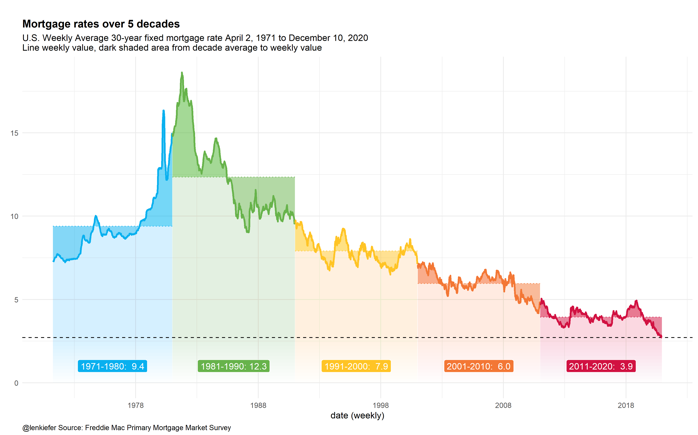
I then went over some charts I’ve used recently in talks I’ve given and discussed how I used (or didn’t use) the guidelines in that chart.
Author(s): Len Kiefer
Publication Date: 26 February 2021
Publication Site: LenKiefer.com