Link: https://booth.lse.ac.uk/map/12/-0.0421/51.5132/100/0
Graphic:
Additional: https://booth.lse.ac.uk/learn-more/what-were-the-poverty-maps
Excerpt:
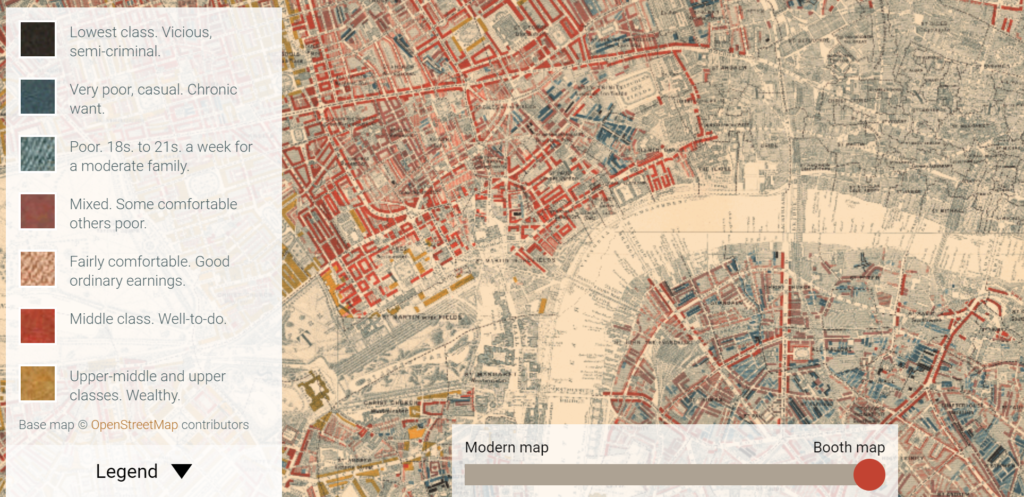
The Maps Descriptive of London Poverty are perhaps the most distinctive product of Charles Booth’s Inquiry into Life and Labour in London (1886-1903). An early example of social cartography, each street is coloured to indicate the income and social class of its inhabitants.
….
Descriptive Map of London Poverty 1889
The first edition of the poverty maps was based on information gathered from School Board visitors. A first sheet covering the East End was published in the first volume of Labour and Life of the People, Volume 1: East London (London: Macmillan, 1889) as the Descriptive Map of East End Poverty. The map was expanded in 1891 to four sheets – covering an area from Kensington in the west to Poplar in the east, and from Kentish Town in the north to Stockwell in the south – and published in subsequent volumes of the survey. These maps are collectively known as the Descriptive Map of London Poverty 1889. They use Stanford’s Library Map of London and Suburbs at a scale of 6 inches to 1 mile (1:10560) as their base. A digital image of the 1889 map has been made by the University of Michigan.
The original working maps from this first edition of the poverty maps are held at the Museum of London. These are hand-coloured and use the 1869 Ordnance Survey 1:2500 maps as their base.
Download the maps: https://booth.lse.ac.uk/learn-more/download-maps