I Finance The Current Thing

Link: https://allenfarrington.medium.com/i-finance-the-current-thing-7ea204230315

Excerpt:

Passive investing is most often celebrated as a marvel of risk/reward packaging for the retail investor, who surely doesn’t have the time or energy to do the job of a professional capital allocator. It’s a fair assumption that they have their own job doing something productive in the real economy. Is this arrangement worth sacrificing? Would sacrificing it be ESG-friendly? Yes, absolutely it would, but we will return to this further down.

Passive investing relies on the notion of an index, or, a numerical weighting of every publicly listed company in a given geography, above a certain size, etc. which is determined by relative size and expressed as a percentage of the whole. If the value of all shares outstanding multiplied by their current market price (or, “market capitalization”) of Company A is 1% of the total of all the companies in an index, then it makes up 1% of that index, and its shares are 1% of those held by a passive investment instrument.

The existence of indices is the bane of the lived experience of investment professionals who take Schumpeter a little more seriously and do not allocate by algorithm but by analysis of business fundamentals. “Performance” is measured relative to an index, on the understandable but perverse realization that index investing, which relies only on an algorithm, is much cheaper for the client. If your non-passive (or “active”) manager returned you 50%, you might think that is fantastic, but if the index went up 60% then you paid for nothing. In fact, technically they underperformed by 10%. No performance fees — even on 50%! — and probably also fired.

….

When SEC Commissioner Hester Peirce voiced the lone dissent against the inclusion of “climate risks” in company prospectuses recently, her argument was basically my own above: these are risks. Although the concept is incredibly technically involved, real investors know how to deal with risks and do not need to be condescended to about which deserve their attention more than others. “We are not the securities and environment commission,” Peirce warned, adding, “at least not yet.” Quite right. I would hope not ever if the rule of law is to be taken seriously, and exactly this kind of regulatory capture via backdoor-compliance enforcement of virtue signaling is to stop.

But could we probe deeper still? ESG is an attack vector, but what is the attack surface? Without intending to be flippant, I think it is centralization. Capital markets are centralized institutions and they are being attacked. So far, so bleak. Can we do anything about it? And what was that Thiel talk actually about, again?

Author(s): Allen Farrington

Publication Date: 21 April 2022

Publication Site: Medium
Statistics with Zhuangzi

Link: https://tsangchungshu.medium.com/statistics-with-zhuangzi-b75910c72e50

Graphic:

Excerpt:

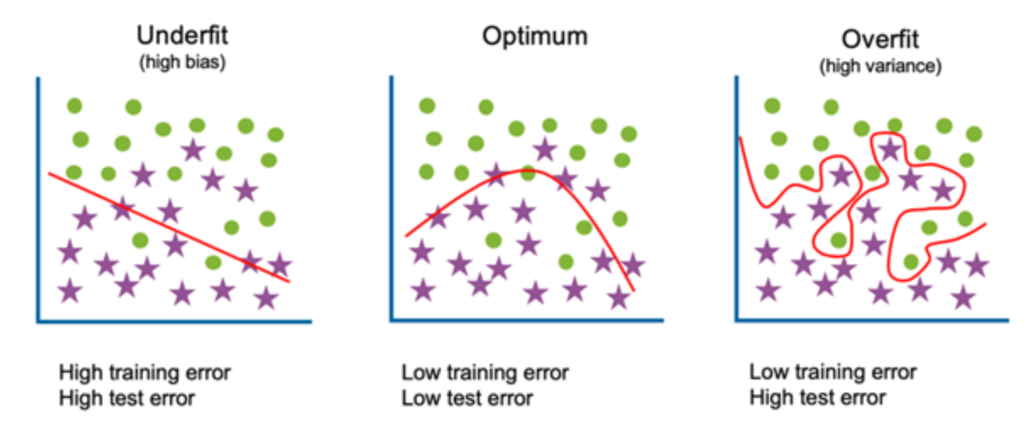
The next section is another gratuitous dunk on Confucius, but it’s also a warning about the perils of seeing strict linear relationships where there are none. Not only will you continually be disappointed/frustrated, you won’t know why.

In this story, Laozi suggests that Confucius’ model of a world in which every additional unit of virtue accumulated will receive its corresponding unit of social recognition is clearly not applicable to the age in which they lived.

Moreover, this results in a temptation is to blame others for not living up to your model. Thus, in the years following the 2007 crash, Lehman brothers were apostrophised for their greed, but in reality all they had done was respond as best they could to the incentives that society gave them. If we wanted them to behave less irresponsibly, we should have pushed government to adjust their incentives. They did precisely what we paid them to. If we didn’t want this outcome, we should have anticipated it and paid for something else.

Author(s): Ts’ang Chung-shu

Publication Date: 20 Sept 2021

Publication Site: Medium

Inequality, not gerontocracy — Who killed interest rates?

Link: https://doctorow.medium.com/inequality-not-gerontocracy-fbd7d012ba4a

Graphic:

Excerpt:

The received wisdom among economists is that the US’s historical low interests rates are driven by high savings by aging boomers who are getting ready for, or in, retirement.

The idea is boomers have salted away so much cash that banks don’t bid for their savings, so interest rates fall.

But at last week’s Jackson Hole conference, a trio of economists presented a very different explanation for low interest, one that better fits the facts.

…..

So we can’t really say that low interest rates are being caused by an aging population with high retirement savings, because while the US population is aging, it does not have high savings. Quite the contrary.

And, as Robert Armstrong points out in his analysis of the paper for the Financial Times, even in places like Japan, with large cohorts of retirees and near-retirees who do have adequate savings, rates are scraping bottom.

…..

So why are rates so low? Well, the paper says it is being caused by high levels of savings — just not aging boomers’ savings. Rather, it’s the savings of the ultra-wealthy, the 1%, who are sitting on mountains of unproductive capital, chasing returns.

Author(s): Cory Doctorow

Publication Date: 1 September 2021

Publication Site: Cory Doctorow at Medium.com

Credit Where Credit is Due: Mary Eleanor Spear

Link: https://medium.com/nightingale/credit-where-credit-is-due-mary-eleanor-spear-6a7a1951b8e6

Graphic:

Excerpt:

On page 166 of her 1952 book, in a chapter titled “The Bar Chart”, Spear shows very clearly an early form of a chart type called the Box Plot that she calls the “Range Bar.” …..

What’s interesting about this to me is that if you look up the Wikipedia page for Box Plot, at the present moment, you will not find Spear’s name appearing anywhere in the article. You will, however, read the following:

“Since the mathematician John W. Tukey introduced this type of visual data display in 1969, several variations on the traditional box plot have been described.”

The way I see it, the range bar appearing in Spear’s book is close enough in form to the box plot to warrant a mention on this Wikipedia page. Hopefully, by the time you read this, you’ll be able to find an updated page for the box plot with her name included on it.

Author(s): Ben Jones

Publication Date: 6 August 2019

Publication Site: Nightingale at Medium

Florence Nightingale is a Design Hero

Link: https://medium.com/nightingale/florence-nightingale-is-a-design-hero-8bf6e5f2147

Graphic:

Excerpt:

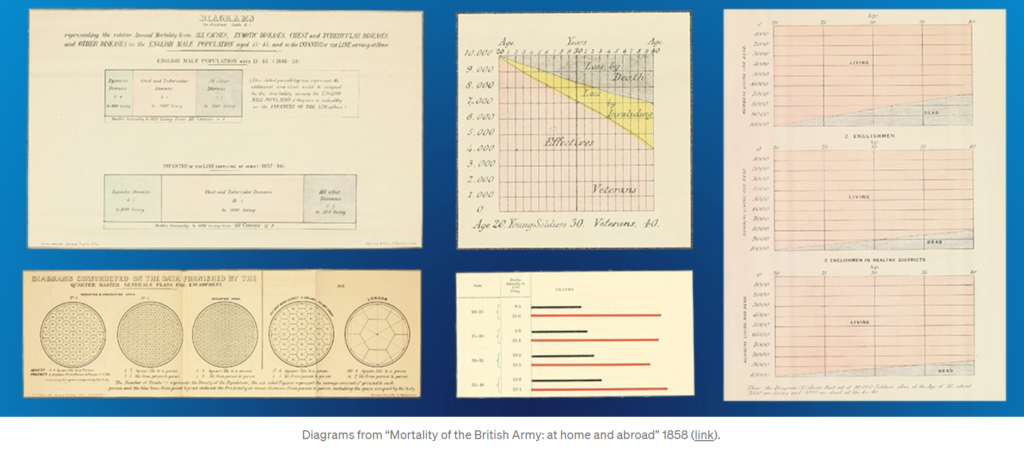
On trips through Europe, Nightingale displayed a natural inclination to record data: distance and times traveled were neatly cataloged in her journal. She hoarded information pamphlets, especially those concerning laws, social conditions, and benevolent institutions. In a Parisian salon, Mary Clarke showed Nightingale how bold, independent, intelligent, and equal to men a woman can be.

In Egypt, Nightingale cruised the Nile and discovered ancient mysticism. Near Thebes, God called Florence Nightingale to nursing. God called me in the morning and asked me would I do good for him alone without reputation. But rich kids do not become nurses. Nursing was below Nightingale’s class. Her family disapproved.

Author(s): RJ Andrews

Publication Date: 15 July 2019

Publication Site: Nightingale at Medium

New Nightingale Editorial Standards

Link: https://medium.com/nightingale/new-nightingale-editorial-standards-6cada1125d7d

Excerpt:

Always include a high-resolution image at the top of your story. This has the following benefits:

When people share your story on Facebook and Twitter, it will be more prominent in news feeds, making people more likely to click on it.

Our readers prefer images of data visualizations.

If you’re having a hard time, you can always look at the free-image services like PixabayPexels, or Unsplash or discuss it with your editor.

Author(s): Jason Forrest

Publication Date: 22 February 2021

Publication Site: Nightingale at Medium

The Unexpected Case of the Disappearing Flu

Link: https://medium.com/illumination-curated/the-unexpected-case-of-the-disappearing-flu-64fd1fa5e909

Graphic:

Excerpt:

During the months preceding the surge of SARS-CoV-2 infections this fall and winter, many public health officials expressed concern about the potential for a “double-barreled” respiratory virus season. In this scenario, healthcare facilities would be totally overwhelmed by: 1) patients afflicted by infections caused by endemic respiratory viruses (such as influenza) that occur during any normal year, and 2) a massive influx of coronavirus patients. Fortunately, such a catastrophe did not come to pass. The reason for this is an unprecedented reduction in flu prevalence for the 2020–21 season.

…..

So perhaps a biological process, whereby viruses engage in some form of competition, or interactions, can better explain disappearances such as those currently being observed.

Subsequent research has borne out real world examples related to the phenomenon described by Simpson. According to a group of researchers at Yale, it is likely that a 2009 autumn rhinovirus epidemic interrupted the spread of influenza. The authors of that study write: “one respiratory virus can block infection with another through stimulation of antiviral defenses in the airway mucosa”. Results from another study, conducted in mice, support those findings. Mice were infected with either a rhinovirus or a murine coronavirus, and it was found that both attenuated influenza disease. Moreover, it was observed that the murine coronavirus infection reduced early replication of the influenza virus. In another study, negative interactions between noninfluenza and influenza viruses were suggested. According to the authors: “when multiple pathogens cocirculate this can lead to competitive or cooperative forms of pathogen–pathogen interactions. It is believed that such interactions occur among cold and flu viruses”. A recently published study examining the effects of interactions between an adenovirus and influenza in mice suggested that certain respiratory infections could impede “other viruses’ activities within the respiratory tract without attacking unrelated viruses directly”. Finally, in a paper entitled “A systematic approach to virus–virus interactions”, the authors state: “increasing evidence suggests that virus–virus interactions are common and may be critical to understanding viral pathogenesis”.

Author(s): M.G. Sunde

Publication Date: 16 January 2021

Publication Site: Illumination at Medium

Improving on perfection — where next for the spreadsheet?

Link: https://medium.com/dawn-capital/improving-on-perfection-where-next-for-the-spreadsheet-7e15c99e7e5c

Graphic:

Excerpt:

The sheer versatility and accessibility of the spreadsheet has made it the Swiss Army Knife of modern day productivity, inserting itself into almost every workflow across every industry. Over the past three decades, spreadsheets have become the de facto way for information to be collected, distributed and analysed.

But, as our operational and computational needs become ever greater, the limits of Excel become clear, and opportunities emerge for companies and tools to replace the spreadsheet.

Author(s): Dawn Capital

Publication Date: 16 December 2021

Publication Site: Medium

Demystifying Vaccination Metrics

Link: https://medium.com/nightingale/demystifying-vaccination-metrics-cd0a29251dd2

Graphic:

Excerpt:

3. Display distribution (supply) and administration (demand) data together for a more complete picture of the vaccine rollout.

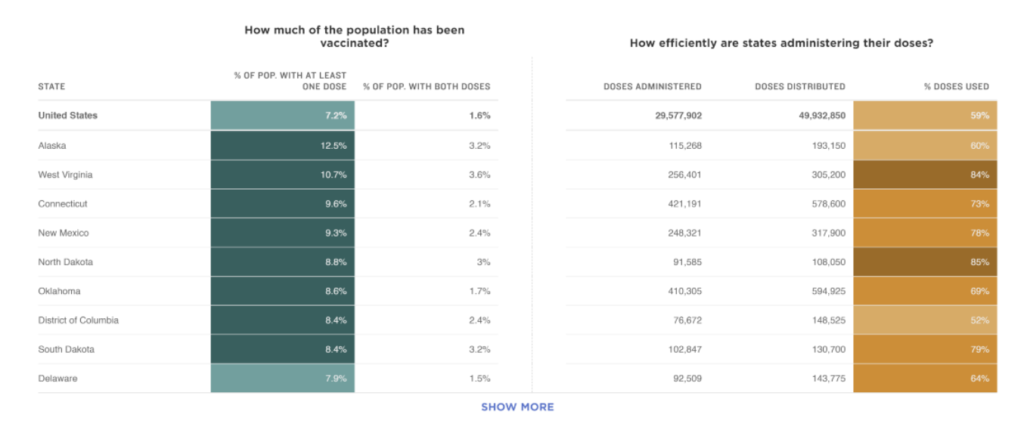
To make sense of what was happening with COVID cases, charts from groups like the COVID-19 Tracking Project clustered trends on testing, cases, hospitalizations, and deaths for a more complete picture. Similarly, we can’t look at data on doses administered in isolation to understand how a country or state is performing on vaccine rollout.

The New York Times displays a combination of the percent of people given at least one shot or two shots and information about the doses distributed and the share of doses used. Together, these metrics give a high level snapshot of information about supply distributed and administered. Note that understanding demand requires knowing more than how many people received shots though, which is likely influenced by supply.

Author(s): Amanda Makulec

Publication Date: 1 February 2021

Publication Site: Nightingale at Medium