Link: https://content.naic.org/sites/default/files/capital-markets-special-reports-cmbs-ye2024.pdf
Graphic:
Executive Summary:
- The U.S. insurance industry’s exposure to agency and private-label commercial mortgage-backed
securities (CMBS) totaled $287 billion at year-end 2024, a 1% year-over-year (YOY) increase. - Property/casualty (P/C) insurance companies were the primary driver of growth, with their agency
CMBS exposure rising 22% to $36 billion. - Agency CMBS accounted for 28% of U.S. insurers’ total CMBS exposure at year-end 2024, reflecting
a steady increase from 24% at year-end 2022. - The credit quality of the CMBS portfolio remained stable overall, with investments carrying an
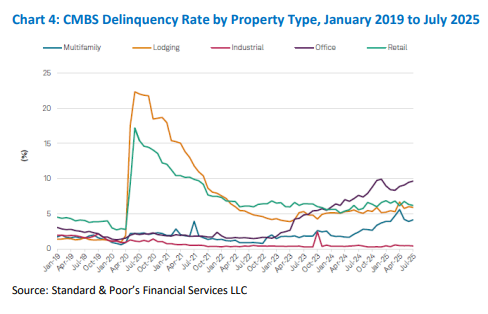
NAIC 1 designation or NAIC 2 designation totaling 97.6% of total exposure at year-end 2024. - Office property delinquency rates remain elevated at 9.6% as of July 2025, according to S&P Global
Ratings (S&P Global) data.
Author(s): Michele Wong and Hankook Lee
Publication Date: 16 Oct 2025
Publication Site: NAIC, Capital Markets Special Report