Link: https://www.nber.org/research/data/us-business-cycle-expansions-and-contractions
Graphic:
Publication Date: last update 19 July 2021, accessed 1 Nov 2022
Publication Site: NBER
All about risk
Link: https://www.nber.org/research/data/us-business-cycle-expansions-and-contractions
Graphic:
Publication Date: last update 19 July 2021, accessed 1 Nov 2022
Publication Site: NBER
Link: https://fredhelp.stlouisfed.org/fred/data/understanding-the-data/recession-bars/
Excerpt:
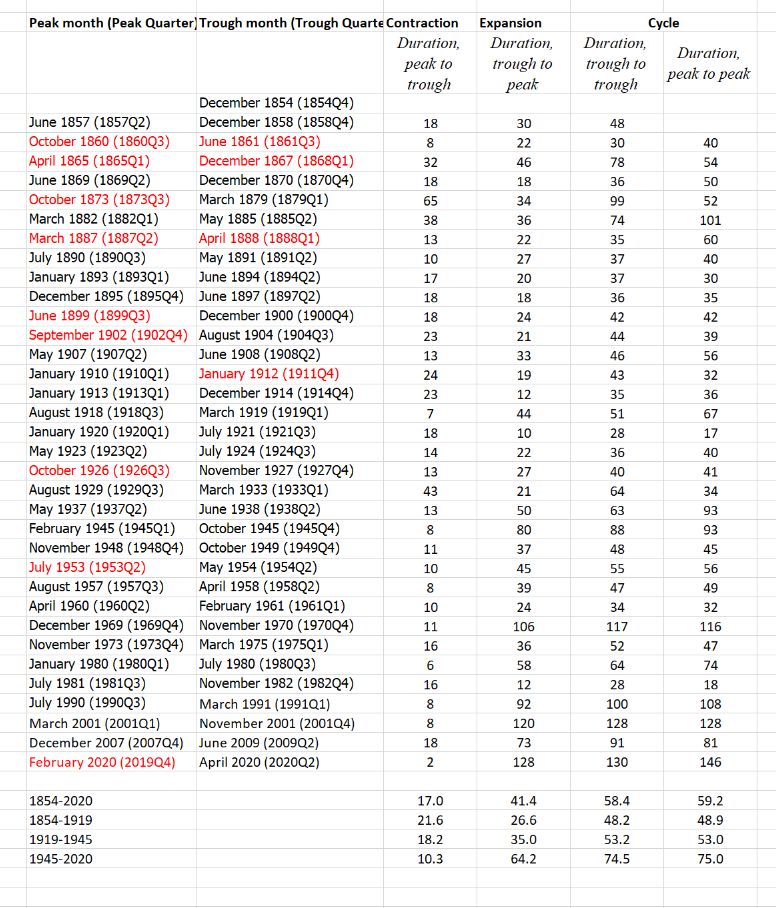
The monthly business cycle turning point dates on FRED graphs are as follows:
Peak, Trough
1857-06-01, 1858-12-01
1860-10-01, 1861-06-01
1865-04-01, 1867-12-01
1869-06-01, 1870-12-01
1873-10-01, 1879-03-01
1882-03-01, 1885-05-01
1887-03-01, 1888-04-01
1890-07-01, 1891-05-01
1893-01-01, 1894-06-01
1895-12-01, 1897-06-01
1899-06-01, 1900-12-01
1902-09-01, 1904-08-01
1907-05-01, 1908-06-01
1910-01-01, 1912-01-01
1913-01-01, 1914-12-01
1918-08-01, 1919-03-01
1920-01-01, 1921-07-01
1923-05-01, 1924-07-01
1926-10-01, 1927-11-01
1929-08-01, 1933-03-01
1937-05-01, 1938-06-01
1945-02-01, 1945-10-01
1948-11-01, 1949-10-01
1953-07-01, 1954-05-01
1957-08-01, 1958-04-01
1960-04-01, 1961-02-01
1969-12-01, 1970-11-01
1973-11-01, 1975-03-01
1980-01-01, 1980-07-01
1981-07-01, 1982-11-01
1990-07-01, 1991-03-01
2001-03-01, 2001-11-01
2007-12-01, 2009-06-01
2020-02-01, 2020-04-01
Publication Date: accessed 1 Nov 2022
Publication Site: FRED
Link: https://www.nber.org/business-cycle-dating-procedure-frequently-asked-questions
Excerpt:
Q: The financial press often states the definition of a recession as two consecutive quarters of decline in real GDP. How does that relate to the NBER’s recession dates?
A: Most of the recessions identified by our procedures do consist of two or more consecutive quarters of declining real GDP, but not all of them. In 2001, for example, the recession did not include two consecutive quarters of decline in real GDP. In the recession from the peak in December 2007 to the trough in June 2009, real GDP declined in the first, third, and fourth quarters of 2008 and in the first and second quarters of 2009. Real GDI declined for the final three quarters of 2001 and for five of the six quarters in the 2007–2009 recession.
Q: Why doesn’t the committee accept the two-quarter definition?
A: There are several reasons. First, we do not identify economic activity solely with real GDP, but consider a range of indicators. Second, we consider the depth of the decline in economic activity. The NBER definition includes the phrase, “a significant decline in economic activity.” Thus real GDP could decline by relatively small amounts in two consecutive quarters without warranting the determination that a peak had occurred. Third, our main focus is on the monthly chronology, which requires consideration of monthly indicators. Fourth, in examining the behavior of production on a quarterly basis, where real GDP data are available, we give equal weight to real GDI. The difference between GDP and GDI—called the “statistical discrepancy”—was particularly important in the recessions of 2001 and 2007–2009.
Author(s):
Publication Date: 19 July 2021 last updated, accessed 3 August 2022
Publication Site: NBER
Link: https://www.nber.org/papers/w30187
Graphic:
Abstract:
We study aggregate lapsation risk in the life insurance sector. We construct two lapsation risk factors that explain a large fraction of the common variation in lapse rates of the 30 largest life insurance companies. The first is a cyclical factor that is positively correlated with credit spreads and unemployment, while the second factor is a trend factor that correlates with the level of interest rates. Using a novel policy-level database from a large life insurer, we examine the heterogeneity in risk factor exposures based on policy and policyholder characteristics. Young policyholders with higher health risk in low-income areas are more likely to lapse their policies during economic downturns. We explore the implications for hedging and valuation of life insurance contracts. Ignoring aggregate lapsation risk results in mispricing of life insurance policies. The calibrated model points to overpricing on average. In the cross-section, young, low-income, and high-health risk households face higher effective mark-ups than the old, high-income, and healthy.
Author(s): Ralph S. J. Koijen, Hae Kang Lee & Stijn Van Nieuwerburgh
WORKING PAPER 30187
DOI 10.3386/w30187
Publication Date: July 2022
Publication Site: NBER
Link: https://www.nber.org/papers/w29902
Graphic:
PDF link: https://www.nber.org/system/files/working_papers/w29902/w29902.pdf
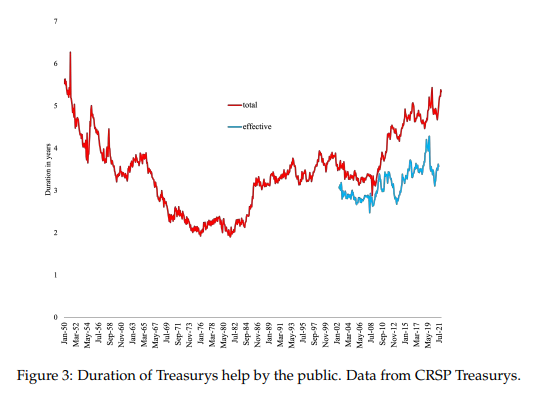
Abstract:
We use discounted cash flow analysis to measure a country’s fiscal capacity. Crucially, the discount rate applied to projected cash flows includes a GDP risk premium. We apply our valuation method to the CBO’s projections for the U.S. federal government’s deficit between 2022 and 2051 and debt in 2051. In spite of low rates, our current measure of U.S. fiscal capacity is lower than the debt/GDP ratio. Because of the backloading of projected surpluses, the duration of the surplus claim far exceeds the duration of the outstanding Treasury portfolio. This duration mismatch exposes the government to the risk of rising rates, which would trigger the need for higher tax revenue or lower spending. Reducing this risk by front-loading the surpluses also requires major fiscal adjustment.
Author(s): Zhengyang Jiang, Hanno Lustig, Stijn Van Nieuwerburgh & Mindy Z. Xiaolan
Publication Date: April 2022
Publication Site: NBER
DOI 10.3386/w29902
WORKING PAPER 29902
Link:https://www.nber.org/papers/w29203
Graphic:
Excerpt:
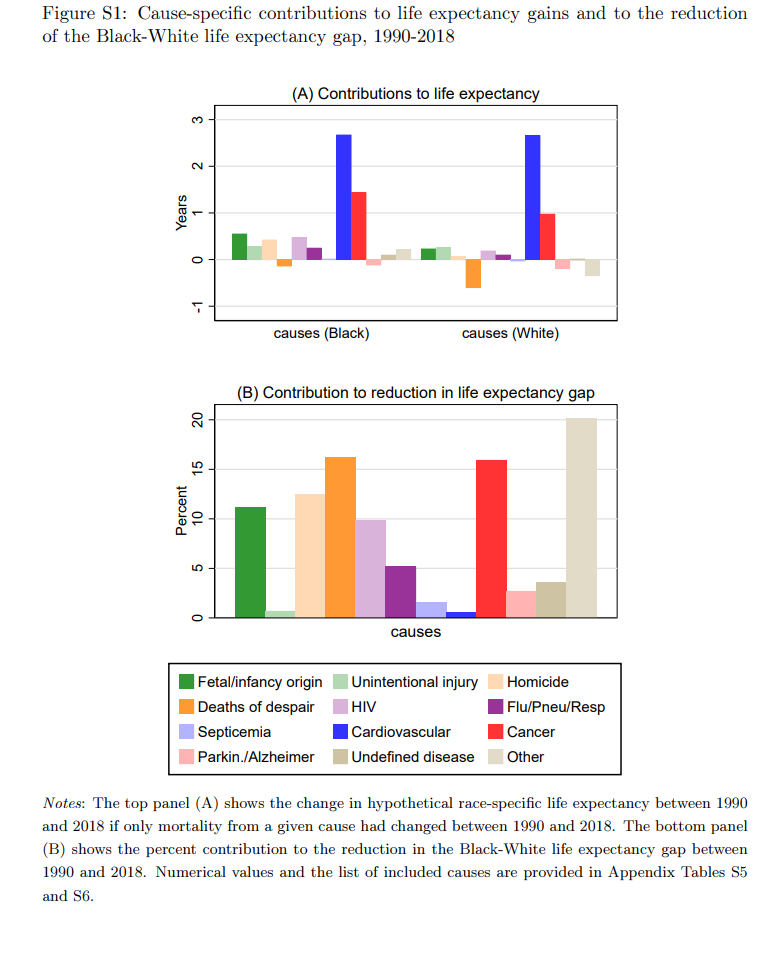
Although there is a large gap between Black and White American life expectancies, the gap fell 48.9% between 1990-2018, mainly due to mortality declines among Black Americans. We examine age-specific mortality trends and racial gaps in life expectancy in rich and poor U.S. areas and with reference to six European countries.
Inequalities in life expectancy are starker in the U.S. than in Europe. In 1990 White Americans and Europeans in rich areas had similar overall life expectancy, while life expectancy for White Americans in poor areas was lower. But since then even rich White Americans have lost ground relative to Europeans. Meanwhile, the gap in life expectancy between Black Americans and Europeans decreased by 8.3%.
Black life expectancy increased more than White life expectancy in all U.S. areas, but improvements in poorer areas had the greatest impact on the racial life expectancy gap. The causes that contributed the most to Black mortality reductions included: Cancer, homicide, HIV, and causes originating in the fetal or infant period.
Life expectancy for both Black and White Americans plateaued or slightly declined after 2012, but this stalling was most evident among Black Americans even prior to the COVID-19 pandemic. If improvements had continued at the 1990-2012 rate, the racial gap in life expectancy would have closed by 2036. European life expectancy also stalled after 2014. Still, the comparison with Europe suggests that mortality rates of both Black and White Americans could fall much further across all ages and in both rich and poor areas.
Author(s): Hannes Schwandt, Janet Currie, Marlies Bär, James Banks, Paola Bertoli, Aline Bütikofer, Sarah Cattan, Beatrice Zong-Ying Chao, Claudia Costa, Libertad Gonzalez, Veronica Grembi, Kristiina Huttunen, René Karadakic, Lucy Kraftman, Sonya Krutikova, Stefano Lombardi, Peter Redler, Carlos Riumallo-Herl, Ana Rodríguez-González, Kjell Salvanes, Paula Santana, Josselin Thuilliez, Eddy van Doorslaer, Tom Van Ourti, Joachim Winter, Bram Wouterse & Amelie Wuppermann
DOI 10.3386/w29203
WORKING PAPER 29203
Publication Date: September 2021
Publication Site: NBER
Link:https://www.wsj.com/articles/why-black-lives-got-longer-nber-longevity-racial-gap-11631905217
Excerpt:
“Between 1990 and 2018,” the paper reports, “the U.S. White-Black life expectancy gap decreased from 7.0 to 3.6 years.” A black person born in the U.S. in 1990 could be expected to live to about age 69, compared to 76 for a white person. In the intervening generation, black life expectancy rose about twice as fast as white life expectancy. A black person born in 2018 could be expected to live just over age 75, compared to just under 79 for a white person.
The drivers, the authors say, are primarily “greater reductions in Black relative to White death rates due to cancer, homicide, HIV, and causes originating in the fetal or infant period.” The most pronounced reductions in black mortality are among children and adults under age 65, rather than the elderly.
“Deaths of despair” (deaths from suicide, drug overdoses, and alcohol-related disease) increased among black and white Americans, especially in the last decade, but took a larger toll on white life expectancy. That accounted for 16.2% of the narrowing of the racial gap. The linear extension of life expectancies for both races stopped after 2012, meaning that it’s hard to see much effect from ObamaCare’s health insurance expansion in the data.
Author(s): The Editorial Board
Publication Date: WSJ
Publication Site: 11 Oct 2021
Link: https://www.kansascityfed.org/documents/8337/JH_paper_Sufi_3.pdf
Graphic:
Excerpt:
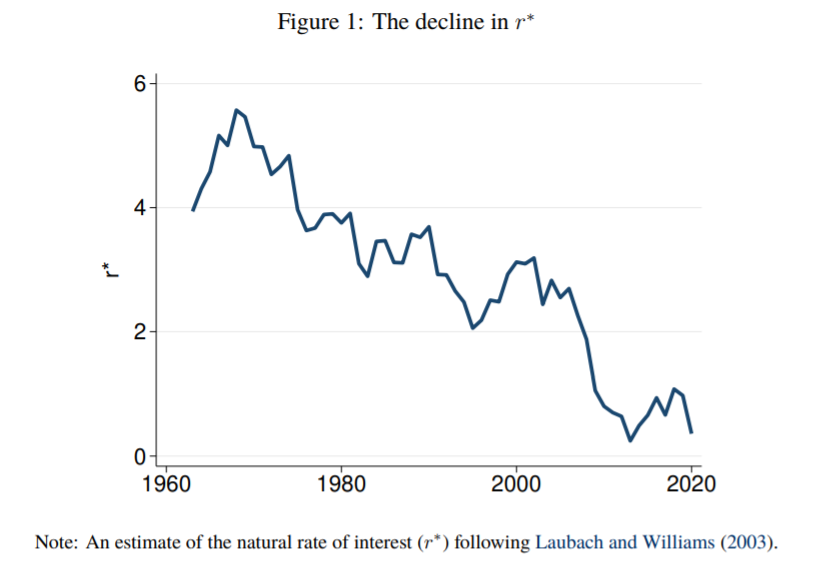
Downward pressure on the natural rate of interest (r∗) is often attributed to an increase in saving. This study uses microeconomic data from the SCF+ to explore the relative importance of demographic shifts versus rising income inequality on the evolution of saving behavior in the United States from 1950 to 2019. The evidence suggests that rising income inequality is the more important factor explaining the decline in r∗. Saving rates are significantly higher for high income households within a given birth cohort relative to middle and low income households in the same birth cohort, and there has been a large rise in income shares for high income households since the 1980s. The result has been a large rise in saving by high income earners since the 1980s, which is the exact same time period during which r∗ has fallen. Differences in saving rates across the working age distribution are smaller, and there has not been a consistent monotonic shift in income toward any given age group. Both findings challenge the view that demographic shifts due to the aging of the baby boom generation explain the decline in r∗.
.
Author(s): Atif Mian, Ludwig Straub, Amir Sufi
Publication Date: August 2021
Publication Site: Kansas City Federal Reserve
Link: https://eml.berkeley.edu//~crwalters/papers/randres.pdf
Graphic:
Abstract:
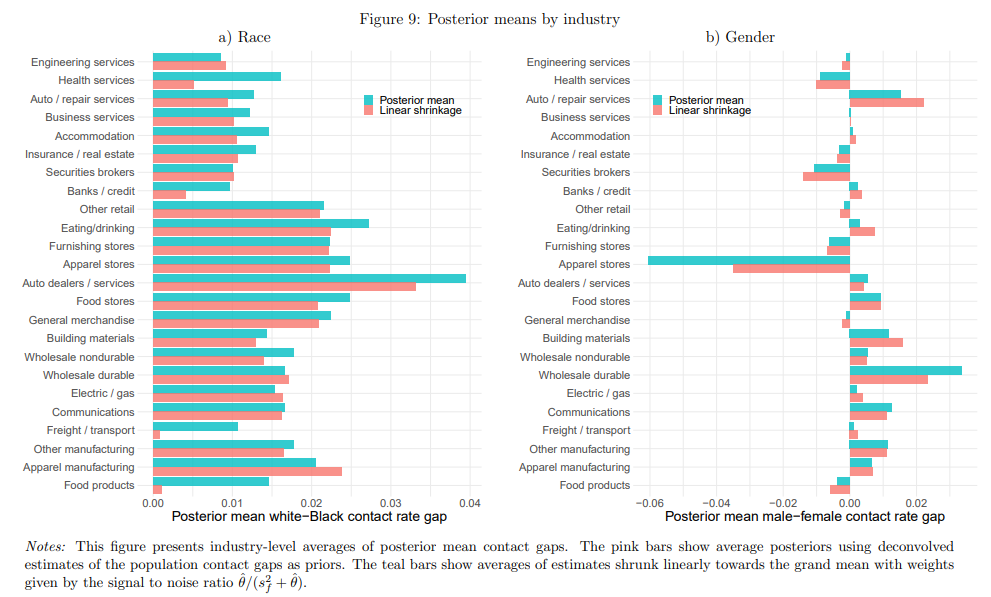
We study the results of a massive nationwide correspondence experiment sending more than
83,000 fictitious applications with randomized characteristics to geographically dispersed jobs
posted by 108 of the largest U.S. employers. Distinctively Black names reduce the probability of
employer contact by 2.1 percentage points relative to distinctively white names. The magnitude
of this racial gap in contact rates differs substantially across firms, exhibiting a between-company
standard deviation of 1.9 percentage points. Despite an insignificant average gap in contact rates
between male and female applicants, we find a between-company standard deviation in gender
contact gaps of 2.7 percentage points, revealing that some firms favor male applicants while
others favor women. Company-specific racial contact gaps are temporally and spatially persistent,
and negatively correlated with firm profitability, federal contractor status, and a measure of
recruiting centralization. Discrimination exhibits little geographical dispersion, but two digit
industry explains roughly half of the cross-firm variation in both racial and gender contact gaps.
Contact gaps are highly concentrated in particular companies, with firms in the top quintile of
racial discrimination responsible for nearly half of lost contacts to Black applicants in the
experiment. Controlling false discovery rates to the 5% level, 23 individual companies are found
to discriminate against Black applicants. Our findings establish that systemic illegal
discrimination is concentrated among a select set of large employers, many of which can be
identified with high confidence using large scale inference methods.
Author(s): Patrick M. Kline, Evan K. Rose, and Christopher R. Walters
Publication Date: July 2021, Revised August 2021
Publication Site: NBER Working Papers, also Christopher R. Walters’s own webpages
Link: https://www.thinkadvisor.com/2021/03/23/5-states-where-pandemic-stress-could-hurt-ceos-health/
Excerpt:
The Great Recession had the mortality effect of increasing a typical CEO’s age by about 1.5 years.
Anti-takeover laws had the mortality effect of decreasing a typical affected CEO’s age by about 2 years.
The Great Recession made an affected CEO look an average of 1.2 years older, based on assessments by computers equipped with age-estimation software.
Author(s): Allison Bell
Publication Date: 23 March 2021
Publication Site: Think Advisor
Link: https://www.nber.org/papers/w28550
Graphic:

Abstract:
We estimate the long-term effects of experiencing high levels of job demands on the mortality and aging of CEOs. The estimation exploits variation in takeover protection and industry crises. First, using hand-collected data on the dates of birth and death for 1,605 CEOs of large, publicly-listed U.S. firms, we estimate the resulting changes in mortality. The hazard estimates indicate that CEOs’ lifespan increases by two years when insulated from market discipline via anti-takeover laws, and decreases by 1.5 years in response to an industry-wide downturn. Second, we apply neural-network based machine-learning techniques to assess visible signs of aging in pictures of CEOs. We estimate that exposure to a distress shock during the Great Recession increases CEOs’ apparent age by one year over the next decade. Our findings imply significant health costs of managerial stress, also relative to known health risks.
Author(s): Mark Borgschulte, Marius Guenzel, Canyao Liu, Ulrike Malmendier
Publication Date: March 2021
Publication Site: NBER
Link: https://www.nber.org/papers/w28474
Abstract:
The past two decades have seen a rapid increase in Private Equity (PE) investment in healthcare, a sector in which intensive government subsidy and market frictions could lead high-powered for-profit incentives to be misaligned with the social goal of affordable, quality care. This paper studies the effects of PE ownership on patient welfare at nursing homes. With administrative patient-level data, we use a within-facility differences-in-differences design to address non-random targeting of facilities. We use an instrumental variables strategy to control for the selection of patients into nursing homes. Our estimates show that PE ownership increases the short-term mortality of Medicare patients by 10%, implying 20,150 lives lost due to PE ownership over our twelve-year sample period. This is accompanied by declines in other measures of patient well-being, such as lower mobility, while taxpayer spending per patient episode increases by 11%. We observe operational changes that help to explain these effects, including declines in nursing staff and compliance with standards. Finally, we document a systematic shift in operating costs post-acquisition toward non-patient care items such as monitoring fees, interest, and lease payments.
Author(s): Atul Gupta, Sabrina T. Howell, Constantine Yannelis & Abhinav Gupta
Publication Date: February 2021
Publication Site: NBER