Link: https://www.sfchronicle.com/projects/2023/maps-migration/
Tweet:
Graphic:
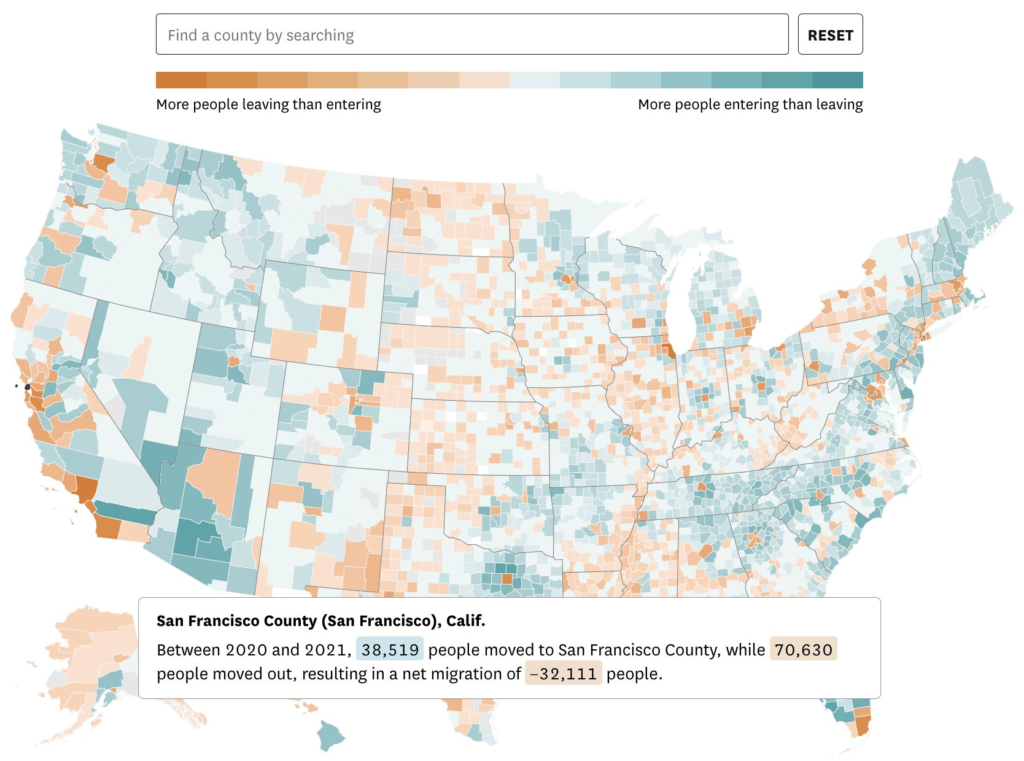
Author(s): Nami Sumida
Publication Date: 2 Jun 2023 (also 31 May 2023) accessed 7 Jun 2023
Publication Site: San Francisco Chronicle
All about risk
Link: https://www.sfchronicle.com/projects/2023/maps-migration/
Tweet:
Graphic:

Author(s): Nami Sumida
Publication Date: 2 Jun 2023 (also 31 May 2023) accessed 7 Jun 2023
Publication Site: San Francisco Chronicle
Link: https://taxfoundation.org/massachusetts-graduated-income-tax-amendment/
Graphic:
Excerpt:
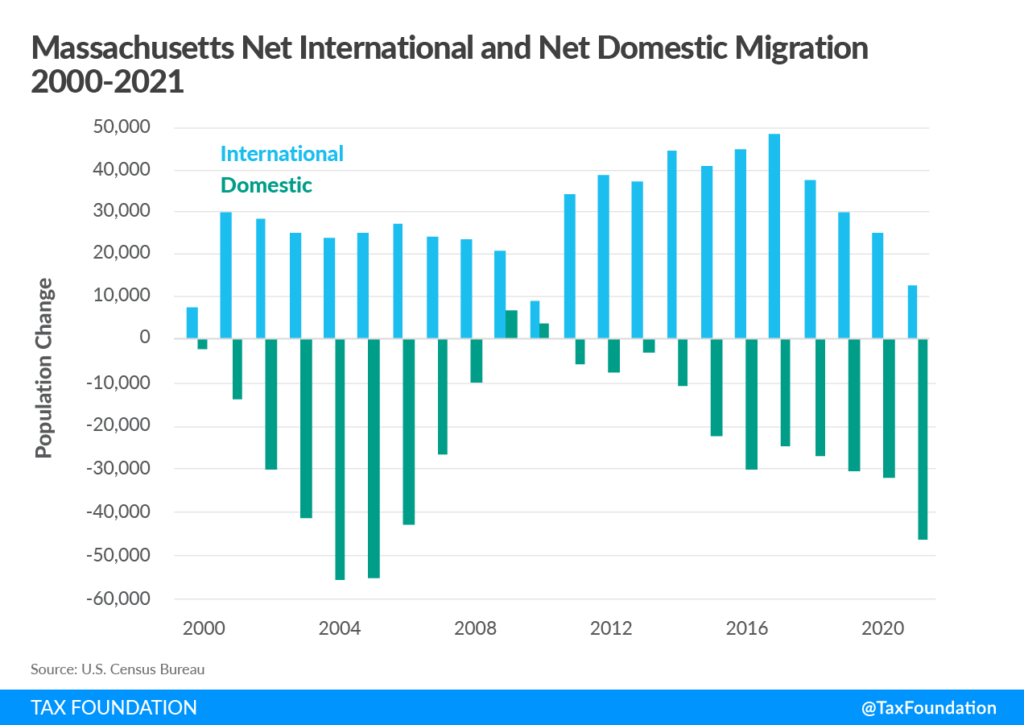
Massachusetts is already trending in the wrong direction in terms of migration. Since 2013, Massachusetts’ net population change levels have been trending downward; and in 2020 the Commonwealth realized its first net negative population change since 2004. Massachusetts lost an estimated 1,309 residents in 2020 but that figure grew to 37,497 by 2021. Much of that change is likely attributable to various changes brought on by the pandemic, including the expansion of remote work opportunities. However, Massachusetts’ struggle with migration precedes the pandemic.
The Bay State’s net migration levels generally mirror the downward trajectory of the net population change figures, but a closer look reveals that Massachusetts was experiencing net negative migration even before the pandemic began. The downward trend for net migration reached net negative levels in 2019, the first year since 2007.
Whether Massachusetts’ net migration figure is positive or negative primarily depends on the strength of net international migration. For 20 of the last 22 years, Massachusetts has seen net negative domestic migration. What this effectively means is that it is preferable to migrate to Massachusetts from abroad, but once a person lives there, it is preferable to move somewhere else. Between July 1, 2020 and July 1, 2021, an estimated 12,675 more people moved to the Bay State from abroad than left for foreign destinations. However, 46,187 more people left Massachusetts for other domestic locations than moved in from elsewhere in the United States.[14] This should concern policymakers, but the figure that should be even more concerning is the net outmigration of adjusted gross income (AGI).
Author(s): Timothy Vermeer
Publication Date: 13 Sept 2022
Publication Site: Tax Foundation
Link: https://www.thinkadvisor.com/2022/08/11/12-states-most-high-earners-are-moving-to/
Graphic:

Excerpt:
U.S. households that earn upward of $200,000 a year can have a significant impact when they move between states, despite their relatively small numbers, according to a recent analysis by SmartAsset. In 2020, these tax filers comprised 6.8% of total tax returns filed across the 50 States and the District of Columbia.
High-earning households’ influence is so great because a state that loses more of them than it gains in a given year may experience a decline in tax revenues and its fiscal situation may worsen.
As part of its analysis, SmartAsset identified the states with the most movement of high-earning households. Researchers examined the inflow and outflow of tax filers making at least $200,000 in each state and the District of Columbia between 2019 and 2020.
Author(s): Michael S. Fischer
Publication Date: 11 Aug 2022
Publication Site: Think Advisor
Graphic:

Excerpt:
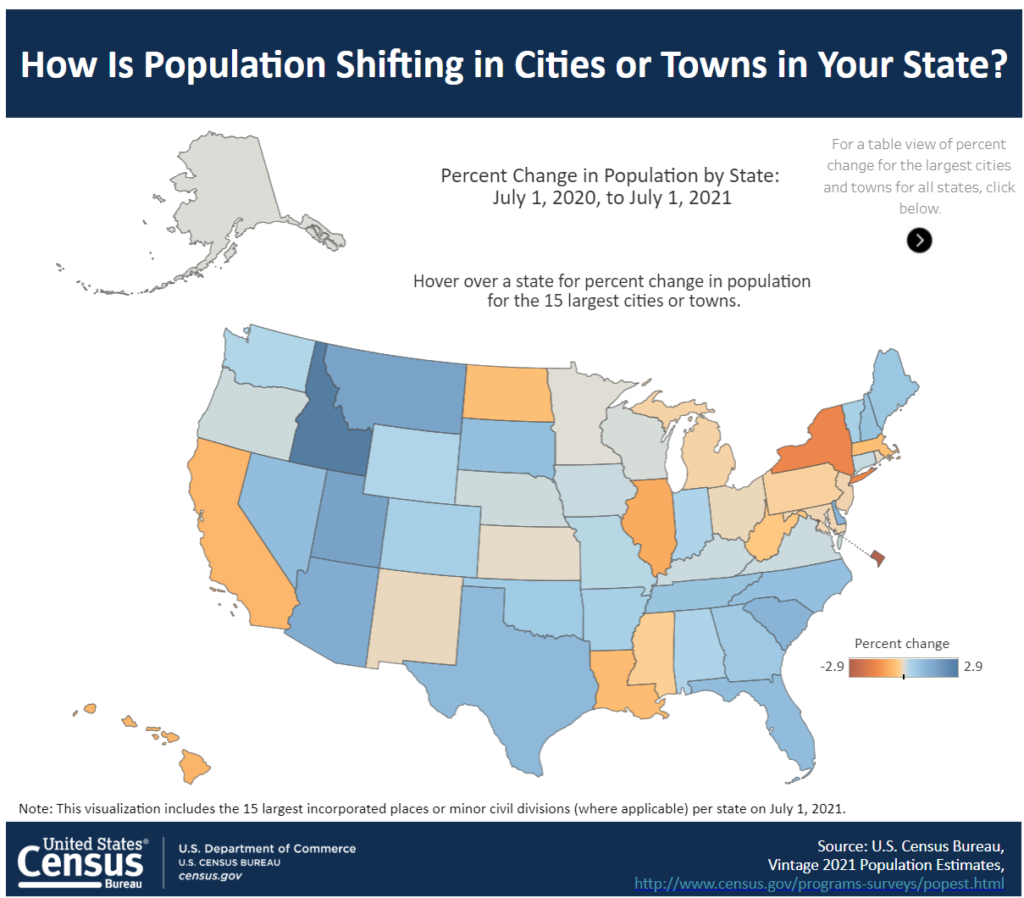
Among the 17 states where population declined over the year, losses were greatest in New York (-1.58%), Illinois (-0.89%), Hawaii (-0.71%) and California (-0.66%). Losses in these states were driven by people moving away.
Four states experienced population declines because more people moved out than in, and more people died than were born: Massachusetts, Mississippi, Michigan, and New Mexico. The data does not separate deaths related to COVID-19 from others.
Aside from states with declines, population grew slower over the year than over the 2010-20 period in 19 states. Among them, Washington, Colorado, and Oregon experienced the biggest slowdown in growth compared with their decade-long pace.
After Idaho and Utah, population grew the fastest in Montana (1.66%), Arizona (1.37%), South Carolina (1.17%), Delaware (1.16%), and Texas (1.06%). Gains in each came mostly from new residents moving into the state.
Fourteen states grew more quickly than their 10-year paces. Idaho, Montana, Maine and New Hampshire sped up the most.
Nationwide, gains from international migration exceeded gains from the natural increase in 2021. It was the first time that newcomers from other countries contributed more to population growth than gains from births in a given year, according to the U.S. Census Bureau.
Author(s): Joanna Biernacka-Lievestro & Alexandre Fall
Publication Date: 12 May 2022
Publication Site: Pew
Excerpt:
The Internal Revenue Service this week released more troubling data for New York, with the federal agency showing more high-earning taxpayers leaving the state.
Tracking returns filed in 2019 and 2020 showed that 479,826 people left New York for another state or country in those years. Over the same timeframe, just 231,439 people moved to the state. That means the state suffered a net loss of 248,387 residents.
And, of course, those people took their money with them. The IRS figures show the moves generated an economic exodus of more than $19.5 billion.
New Jersey and Florida were the biggest beneficiaries. More than 84,500 people moved from New York to New Jersey and took $5.3 billion. By contrast, only 37,127 New Jersey residents moved to New York and brought $2.2 billion in income.
….
Wirepoints, in its analysis, noted New York suffered the worst net loss of income of any state, with the $19.5 billion representing a 2.5 percent decline in adjusted gross income.
Author(s): Steve Bittenbender
Publication Date: 28 May 2022
Publication Site: The Center Square
Graphic:
Excerpt:
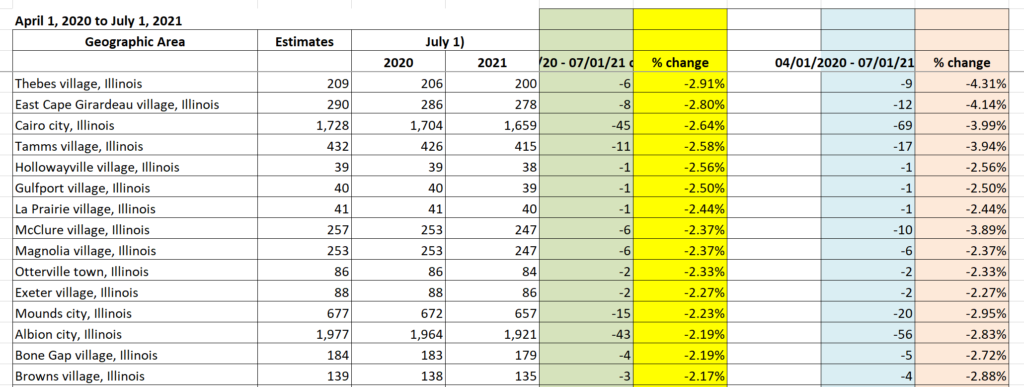
Cities and towns in Illinois lost more than 104,000 people in the 12 months up to July 1, 2021, according to new U.S. Census data released Thursday. Nearly half of Illinois’ losses were from Chicago.
The report for the entire country shows populations continue to shift to towns in the South and West regions of the United States.
“Arizona, Texas, Florida and Idaho all had several places among the 15 fastest-growing cities or towns,” the report said.
Of the 15 largest cities, New York lost nearly 305,500 people. Chicago lost 45,175 people, which was larger than Los Angeles’ loss of 40,537 people. Chicago is the third most populous city behind New York and L.A..
Author(s): Greg Bishop
Publication Date: 26 May 2022
Publication Site: The Center Square
Graphic:
Additional links:
Related Information
Population and Housing Unit Estimates
Produces estimates of the population for the United States, its states, counties, cities, and towns, as well as for the Commonwealth of Puerto Rico.
Our population statistics cover age, sex, race, Hispanic origin, migration, ancestry, language use, veterans, as well as population estimates and projections.
Publication Date: 26 May 2022
Publication Site: U.S. Census
Excerpt:
Tax cuts remain a powerful tool to entice people and firms, and the pandemic has triggered a new tax war. After the lockdowns, states and cities predicted unprecedented revenue drops. Instead, economies bounced back quickly from the pandemic, partly because of widespread adoption of remote work and extensive federal aid from the Trump and Biden administrations — hundreds of billions of dollars in unemployment benefits (which kept individuals spending money), business loans and funding for local governments to fight COVID-19.
The March 2021 Biden stimulus then provided local governments with an unprecedented $350 billion to bolster their budgets. The revenue gusher has produced state budget surpluses where experts had only recently predicted steep deficits.
Nearly a dozen states, mostly Republican-governed, have used the windfall to cut taxes. Idaho reduced its corporate and individual tax rates and shrank its income-tax brackets from seven to five, producing a $163 million tax cut for residents and businesses. The state also sent $220 million in rebates to everyone who filed tax returns in 2019.
….
Advocates for higher taxes often say that the levies don’t drive away wealthy individuals or businesses. When New Jersey raised taxes on the wealthy in November 2020, Democratic Gov. Phil Murphy said, “When people say folks are going to leave, there’s no research anywhere that suggests that happens.”
Yet New Jersey, with taxes on the wealthy and on businesses long ranking among the nation’s highest, ranked a dismal 42nd in economic growth over the five years preceding the pandemic, according to one study, and it has been an economic laggard for two decades. Voters in this overwhelmingly Democratic state showed their disapproval in giving incumbent Murphy an extremely narrow victory in his November reelection bid. Polls showed that most voters favored the Republican position on cutting taxes over Murphy’s.
Author(s): Steven Malanga
Publication Date: 7 Mar 2022
Publication Site: Dallas Morning News
Link: https://taxfoundation.org/state-population-change-2021/
Graphic:
Excerpt:
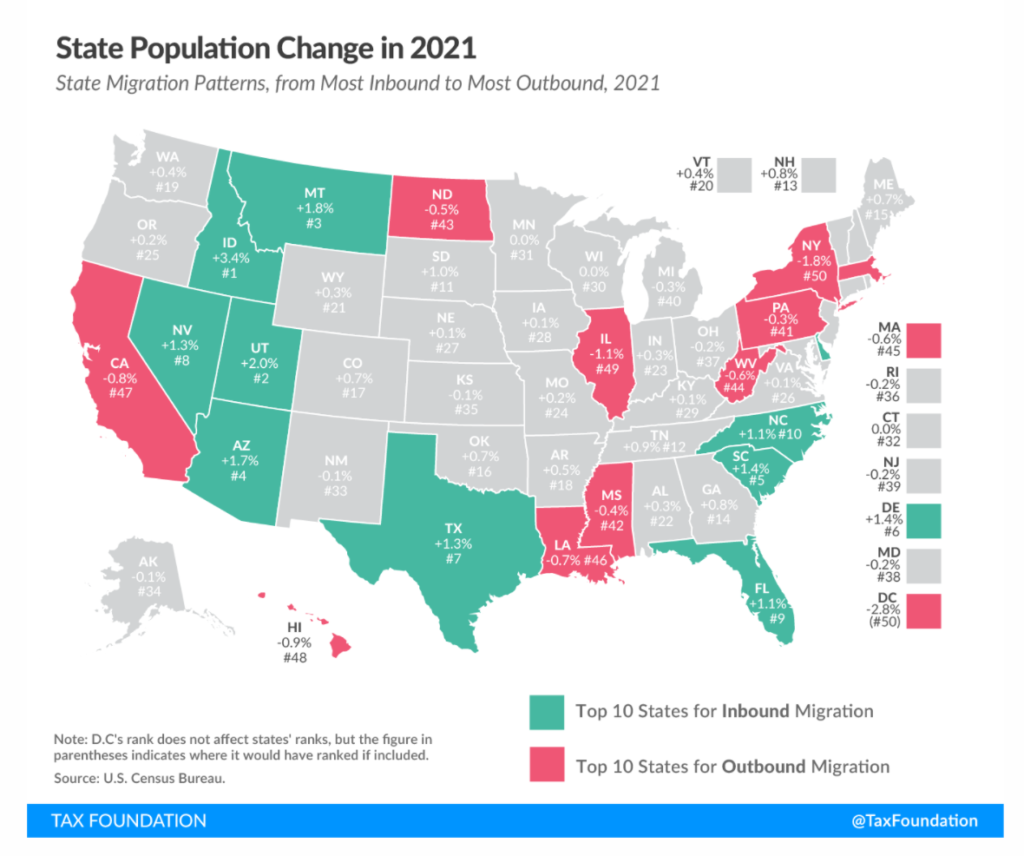
Nationally, the U.S. population only grew by 0.1 percent between July 2020 and July 2021, the lowest rate since the nation’s founding. Pandemic-induced excess deaths, virtually nonexistent international in-migration, and an already-declining birth rate yielded an almost flat population trend nationwide. This, however, belies state-level and regional differences. Whereas the District of Columbia’s population shrunk by 2.8 percent between April 2020 (roughly the start of the pandemic) to July 2021, New York lost 1.8 percent of its population, and Illinois, Hawaii, and California rounded out the top five jurisdictions for population loss, Idaho was gaining 3.4 percent, while Utah, Montana, Arizona, South Carolina, Delaware, Texas, Nevada, Florida, and North Carolina all saw population gains of 1 percent or more.
The picture painted by this population shift is a clear one of people leaving high-tax, high-cost states for lower-tax, lower-cost alternatives. The individual income tax is only one component of overall tax burdens, but it is often highly salient, and is illustrative here. If we include the District of Columbia, then in the top one-third of states for population growth since the start of the pandemic (April 2020 to July 2021 data), the average combined top marginal state and local income tax rate is 3.5 percent, while in the bottom third of states, it is about 7.3 percent.
Author(s): Jared Walczak
Publication Date: 4 Jan 2022
Publication Site: Tax Foundation
Graphic:
Excerpt:
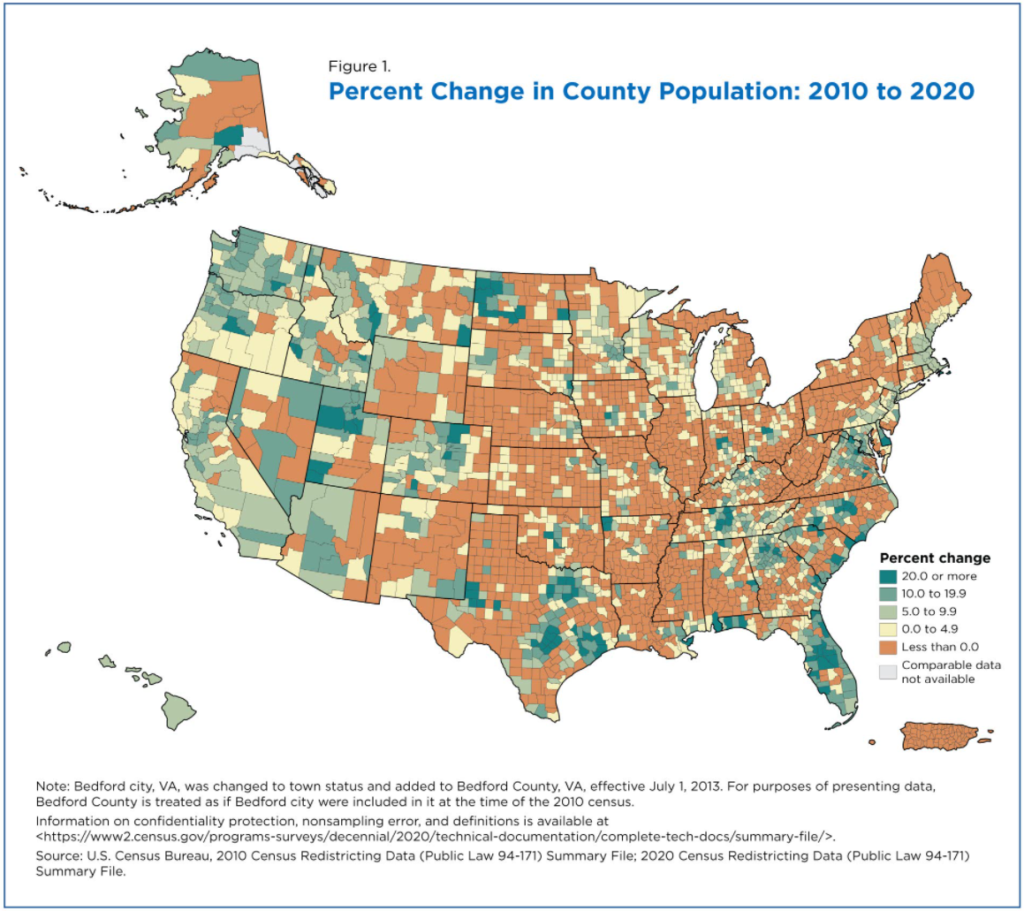
Almost half (47%) of U.S. counties or equivalents gained population between 2010 and 2020 (Figure 1).
Five counties (metro areas in parentheses) gained at least 300,000 people during that period: Harris County, Texas (Houston-The Woodlands-Sugar Land); Maricopa County, Arizona (Phoenix-Mesa-Chandler); King County, Washington (Seattle-Tacoma-Bellevue); Clark County, Nevada (Las Vegas-Henderson-Paradise); and Tarrant County, Texas (Dallas-Fort Worth-Arlington).
California’s Los Angeles County remained the largest county in 2020, crossing the 10.0 million-person mark between 2010 and 2020.
Author(s): PAUL MACKUN, JOSHUA COMENETZ, AND LINDSAY SPELL
Publication Date: 12 August 2021
Publication Site: U.S. Census Bureau
Link: https://www.dailyposter.com/were-going-the-wrong-way/
Graphic:
Excerpt:
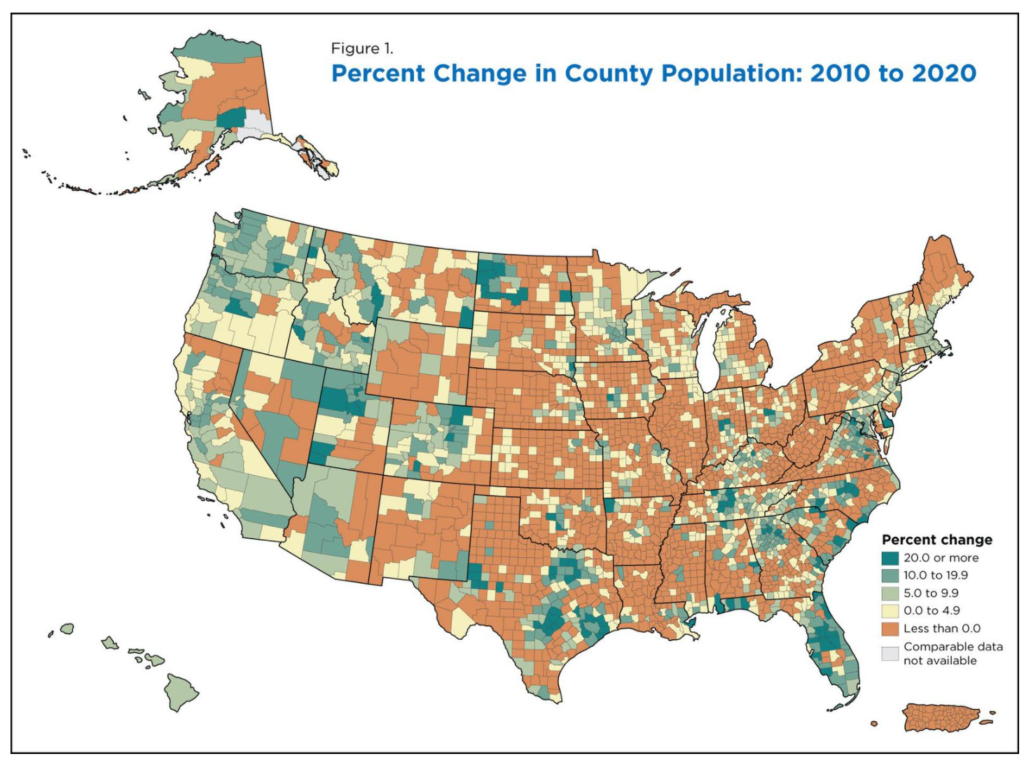
Science has provided America with a decent idea of which areas of our country will be most devastated by climate change, and which areas will be most insulated from the worst effects. Unfortunately, it seems that population flows are going in the wrong direction — today’s new Census data shows a nation moving out of the safer areas and into some of the most dangerous places of all.
…..
Some of the examples are genuinely mind-boggling. For instance, upstate New York is considered one of the country’s most insulated regions in the climate crisis — and yet almost all of upstate New York saw population either nearly flat or declining. At the same time, there were big population increases in and around the Texas gulf coast, which is threatened by extreme heat and coastal flooding.
Similarly, the city of Philadelphia is comparatively well situated in the climate crisis — but it saw only modest population growth of 5 percent. It was surpassed on the list of biggest cities by Phoenix, which saw an 11 percent population growth, despite that city facing some of the worst forms of extreme heat and drought in the entire country.
Author(s): David Sirota, Julia Rock
Publication Date: 12 August 2021
Publication Site: The Daily Poster
Link: https://blog.datawrapper.de/new-york-city-immigration/
Graphic:
Excerpt:
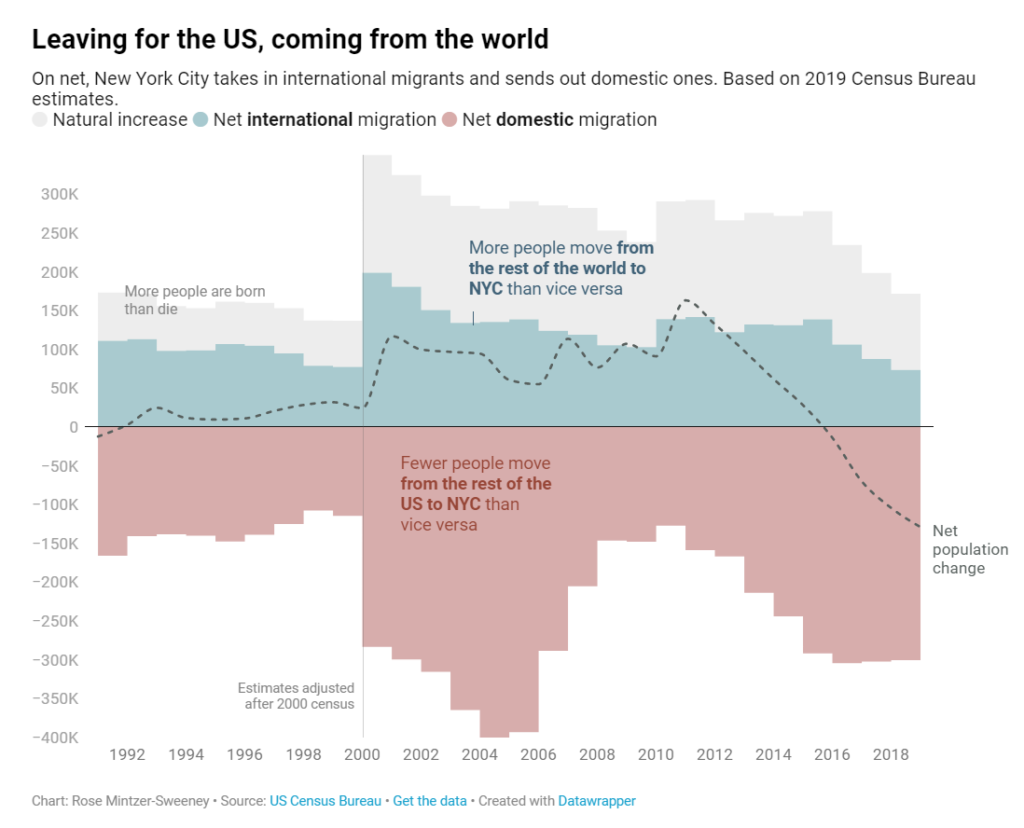
In fact, just having been born here makes me an atypical New Yorker. Of the approximately 8.3 million people who live in the city today, just under half were born in New York State. Eleven percent come from other US states and 40% from the rest of the world. So we’re not wrong to associate New York with immigration—the average New Yorker comes from somewhere else.
I got these numbers from the US Census Bureau, who do their best to estimate not just how many people live in each county, but how they got there: by birth, by migrating from another country, or by migrating from elsewhere in the US. When you take away the people who died, moved abroad, or moved domestically, you’re left with each of these three streams’ net effect on the population that year.[1] Those are the numbers that will show us whether it’s unusual to move away:
Author(s): Rose Mintzer-Sweeney
Publication Date: 3 June 2021
Publication Site: Datawrapper