Mortality and the provision of retirement income

Link: https://www.oecd.org/daf/fin/private-pensions/launch-publication-mortality-provision-retirement.htm

Graphic:

Video:

Excerpt:

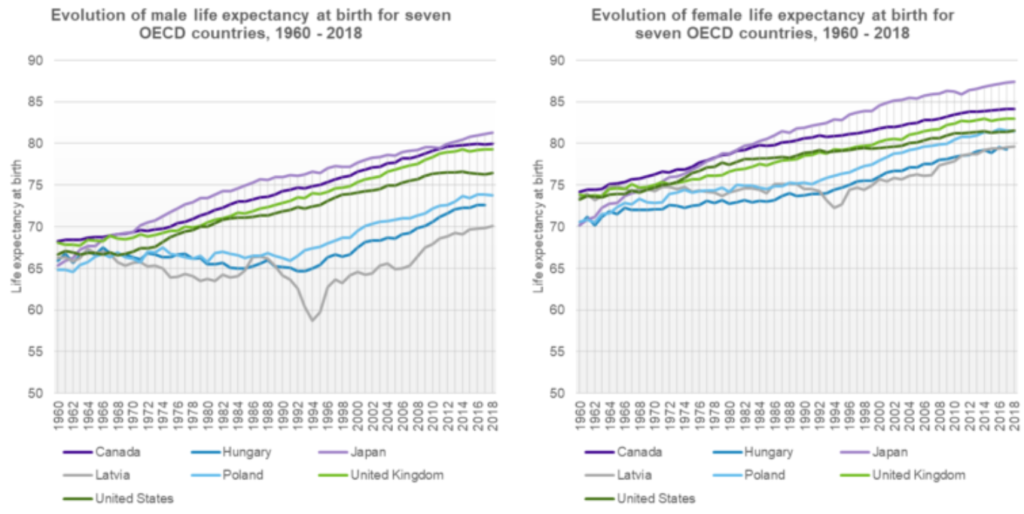
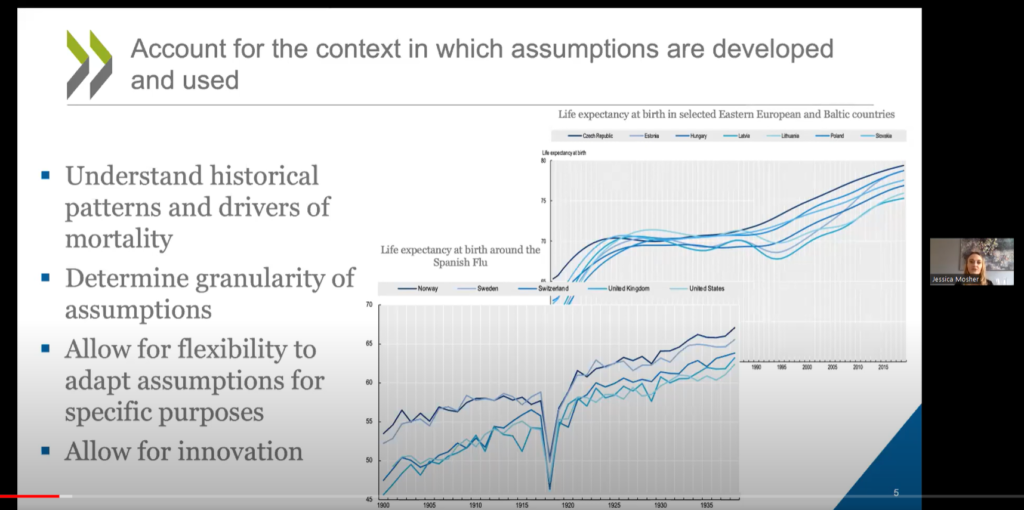
The report analyses the development of mortality assumptions to build mortality tables to better protect retirement income provision. It first provides an international overview of longevity trends and drivers over the last several decades, including the impact of the COVID-19 pandemic. It then explores considerations and traditional approaches for developing mortality tables, and details the standard mortality tables developed across OECD member countries. It concludes with guidelines to assist regulators and supervisors in assessing whether the mortality assumptions and tables used in the context of retirement income provision are appropriate.

The OECD will provide an overview of the publication, followed by a roundtable discussion with government and industry stakeholders. Topics discussed will include:

  • Recent mortality trends and drivers
  • How mortality trends/drivers can inform future expectations, and how to account for that in modelling
  • The challenge of accounting for COVID in setting mortality assumptions
  • Trade-offs for different modelling approaches
  • The usefulness of the guidelines included in the report in practice
  • How to better communicate around mortality assumptions to non-experts

Publication Date: 2 Feb 2023

Publication Site: OECD

Mega trend 10: The democratization of longevity

Link: https://www.clubvita.us/news-and-insights/mega-trend-10-the-democratization-of-longevity

Graphic:

Excerpt:

Illustrated below is the evolution of life expectancy at birth for seven Organization for Economic Co-operation and Development (OECD) countries: Canada, Hungary, Japan, Latvia, Poland, the United Kingdom, and the United States. Across the seven countries, male life expectancy at birth ranged from 64.8 years to 68.2 years in 1960, and 69.8 years to 81.1 years in 2017, demonstrating an increase in the inequality of life expectancy of almost eight years between these countries over the period. For females, the increase was approximately four years. The inequality in life expectancy is more apparent and unsettling if we consider, for example, developing countries in Africa, averaging a life expectancy of around 63 years in 2019.

….

Altogether, I believe greater democratization of longevity is achievable with the adoption of health technologies, while ensuring they are accessible and affordable. I am hopeful but I see several challenges ahead. Such a reality will be reliant on governments, health care professionals, and patients’ acceptance and reliance on what the future of health holds. It will also require global partnerships to build out ecosystems that will facilitate inclusive innovation.

Author(s): Shantel Aris

Publication Date: 22 Sept 2021

Publication Site: Club Vita

Global minimum tax

Link: https://allisonschrager.substack.com/p/known-unknowns-905

Excerpt:

Is it just me or are people obsessed with tax compliance lately? I suppose it is part of this fantasy that high earners and corporations have enough money to pay for all our new spending – we just have to force them to pay up.

You know what might be simpler than jacking up taxes and doubling the size of a government agency? A broader base and simplified tax system that doesn’t leave so much room for getting out of paying taxes. Take the idea of a global minimum corporate tax. Sounds sensible enough; after all, you can’t increase the corporate tax rate too much because it is so easy to send profits overseas where taxes are lower.

But anyone who studied public finance can tell you there’s the tax rate and there’s the tax base. Generally, it is better to have a broader base and a lower rate. You get more revenue that way, and it causes fewer distortions and enhances transparency. Maybe we can convince OECD countries to set a higher corporate rate, but that creates a new race to the bottom to degrade the base. Countries will compete to offer more loopholes and deductions. And that seems worse to me.

Author(s): Allison Schrager

Publication Date: 24 May 2021

Publication Site: Known Unknowns at substack

Sources of Tax Revenue: U.S. vs. OECD

Graphic:

Excerpt:

Compared to the OECD average, the United States relies significantly more on individual income taxes and property taxes. While OECD countries on average raised 24 percent of total tax revenue from individual income taxes, the share in the United States was 41.5 percent, a difference of 17.5 percentage points. This is partially because more than half of business income in the United States is reported on individual tax returns. OECD countries on average raised 5.6 percent of total tax revenue from property taxes, compared to 12.1 percent in the United States.

The United States relies much less on consumption taxes than other OECD countries. Taxes on goods and services accounted for only 17.6 percent of total tax revenue in the United States, compared to 32.3 percent in the OECD. This is because all OECD countries, except the United States, levy value-added taxes (VAT) at relatively high rates. State and local sales tax rates in the United States are relatively low by comparison.

Author(s): Cristina Enache

Publication Date: 17 February 2021

Publication Site: Tax Foundation

Sources of Government Revenue in the OECD

Graphic:

Excerpt:

When comparing average 2019 and 1990 OECD tax revenue sources, the most notable change is a decrease in individual income taxes versus increases in social insurance and consumption taxes. The share of revenues from corporate income taxes has also increased compared to 1990 (despite declining corporate income tax rates[4]). The relative importance of property taxes as a source of revenue has stayed roughly constant.

Author(s): Cristina Enache

Publication Date: 11 February 2021

Publication Site: Tax Foundation