Variations On Approximation – An Exploration in Calculation

Link: https://www.soa.org/news-and-publications/newsletters/compact/2014/january/com-2014-iss50/variations-on-approximation–an-exploration-in-calculation/

Graphic:

Excerpt:

Before we get into the different approaches, why should you care about knowing multiple ways to calculate a distribution when we have a perfectly good symbolic formula that tells us the probability exactly?

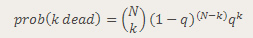
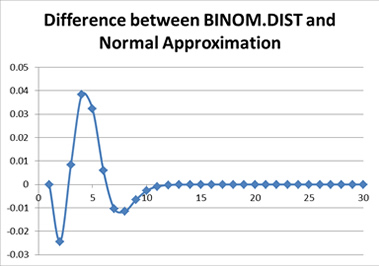
As we shall soon see, having that formula gives us the illusion that we have the “exact” answer. We actually have to calculate the elements within. If you try calculating the binomial coefficients up front, you will notice they get very large, just as those powers of q get very small. In a system using floating point arithmetic, as Excel does, we may run into trouble with either underflow or overflow. Obviously, I picked a situation that would create just such troubles, by picking a somewhat large number of people and a somewhat low probability of death.

I am making no assumptions as to the specific use of the full distribution being made. It may be that one is attempting to calculate Value at Risk or Conditional Tail Expectation values. It may be that one is constructing stress scenarios. Most of the places where the following approximations fail are areas that are not necessarily of concern to actuaries, in general. In the following I will look at how each approximation behaves, and why one might choose that approach compared to others.

Author(s): Mary Pat Campbell

Publication Date: January 2014

Publication Site: CompAct, SOA

Underdispersion in the reported Covid-19 case and death numbers may suggest data manipulations

Link: https://www.medrxiv.org/content/10.1101/2022.02.11.22270841v1

doi: https://doi.org/10.1101/2022.02.11.22270841

Graphic:

Abstract:

We suggest a statistical test for underdispersion in the reported Covid-19 case and death numbers, compared to the variance expected under the Poisson distribution. Screening all countries in the World Health Organization (WHO) dataset for evidence of underdispersion yields 21 country with statistically significant underdispersion. Most of the countries in this list are known, based on the excess mortality data, to strongly undercount Covid deaths. We argue that Poisson underdispersion provides a simple and useful test to detect reporting anomalies and highlight unreliable data.

Author(s): Dmitry Kobak

Publication Date: 13 Feb 2022

Publication Site: medRXiV

Are some countries faking their covid-19 death counts?

Link: https://www.economist.com/graphic-detail/2022/02/25/are-some-countries-faking-their-covid-19-death-counts

Graphic:

Excerpt:

Irregular statistical variation has proven a powerful forensic tool for detecting possible fraud in academic research, accounting statements and election tallies. Now similar techniques are helping to find a new subgenre of faked numbers: covid-19 death tolls.

That is the conclusion of a new study to be published in Significance, a statistics magazine, by the researcher Dmitry Kobak. Mr Kobak has a penchant for such studies—he previously demonstrated fraud in Russian elections based on anomalous tallies from polling stations. His latest study examines how reported death tolls vary over time. He finds that this variance is suspiciously low in a clutch of countries—almost exclusively those without a functioning democracy or a free press.

Mr Kobak uses a test based on the “Poisson distribution”. This is named after a French statistician who first noticed that when modelling certain kinds of counts, such as the number of people who enter a railway station in an hour, the distribution takes on a specific shape with one mathematically pleasing property: the mean of the distribution is equal to its variance.

This idea can be useful in modelling the number of covid deaths, but requires one extension. Unlike a typical Poisson process, the number of people who die of covid can be correlated from one day to the next—superspreader events, for example, lead to spikes in deaths. As a result, the distribution of deaths should be what statisticians call “overdispersed”—the variance should be greater than the mean. Jonas Schöley, a demographer not involved with Mr Kobak’s research, says he has never in his career encountered death tallies that would fail this test.

….

The Russian numbers offer an example of abnormal neatness. In August 2021 daily death tallies went no lower than 746 and no higher than 799. Russia’s invariant numbers continued into the first week of September, ranging from 792 to 799. A back-of-the-envelope calculation shows that such a low-variation week would occur by chance once every 2,747 years.

Publication Date: 25 Feb 2022

Publication Site: The Economist