Graphic:
Author(s): Polimath
Publication Date: 23 Sept 2021
Publication Site: Polimath
All about risk
Graphic:
Author(s): Polimath
Publication Date: 23 Sept 2021
Publication Site: Polimath
Link: https://polimath.substack.com/p/every-states-covid-numbers-in-context-cf7
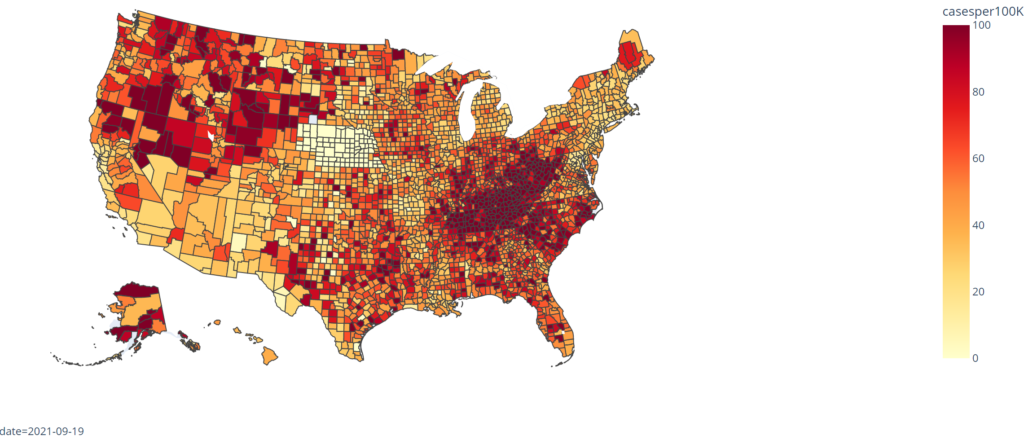
Graphic:
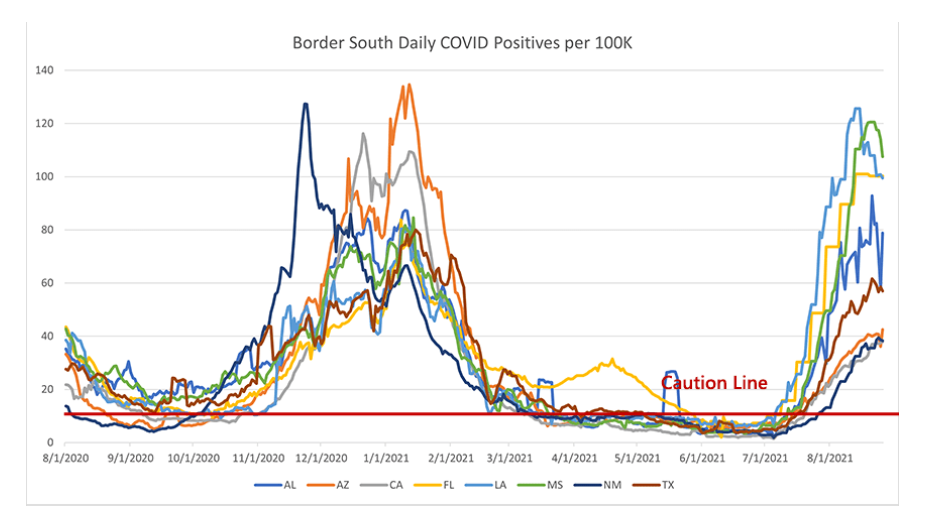
Excerpt:
This region has been the tough one. It looks like we’re on the other side of the case surge in the worst hit states (LA, MS, FL, AL). Daily cases went up much higher than I would have expected, even higher than the winter surge. What has been truly surprising is that Florida is substantially more vaccinated than those other states, about 15-20% higher in adult vaccination and up at 95% vaccinated for seniors. That should shrink their pool of COVID-vulnerable individuals massively and reduce their death rate substantially.
And, while Florida’s death rate is lower than LA and MS, it’s not nearly at the levels we would have hoped or expected. I’m at a loss to explain this. Certain proposals have been tossed around: Florida is an older state, so more of their population is vulnerable. But their vaccination rates (nearly universal coverage among the elderly!) really should suppress this enormously. If a particular age group had +90% vaccination rates, I would expect that group’s COVID deaths to be reduced by at least 70%. Instead, the elderly are still making up the vast majority of COVID deaths in Florida.
Author(s): PoliMath, aka Matt Shapiro
Publication Date: 31 August 2021
Publication Site: Marginally Compelling at substack
Link: https://polimath.substack.com/p/never-trust-a-clean-partisan-story
Graphic:
Before [wrong]:
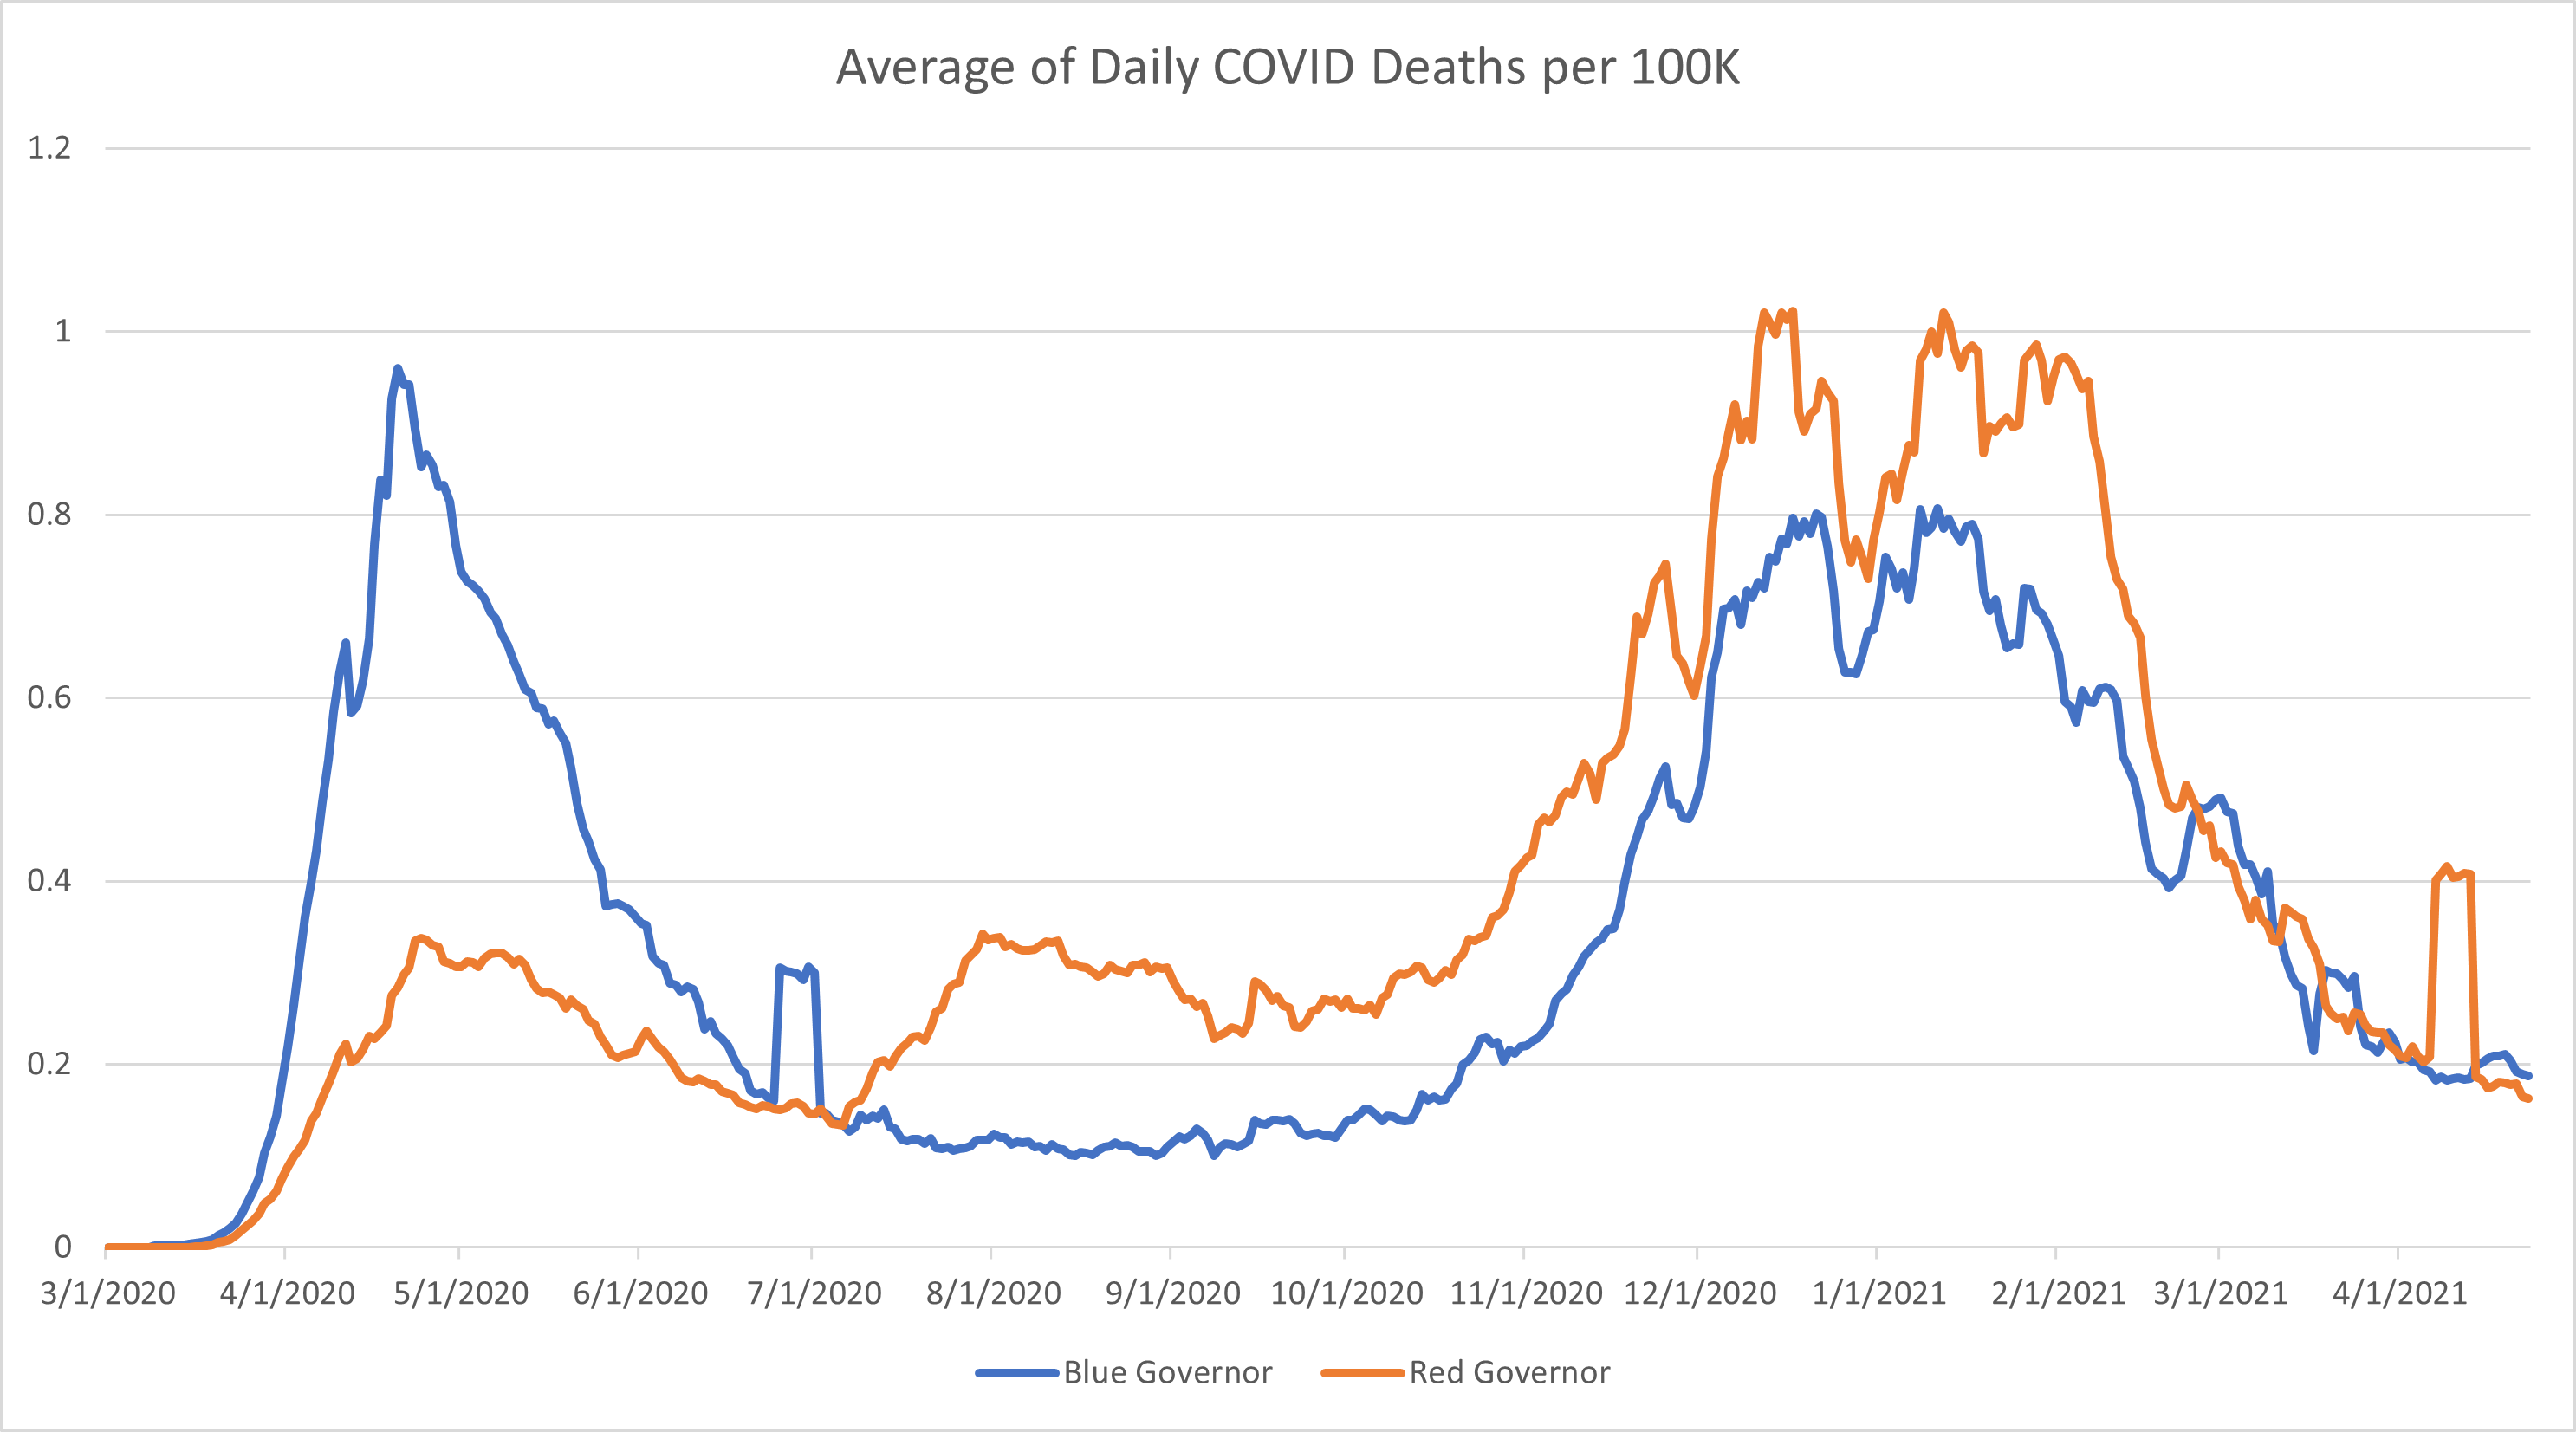
After [correct]:
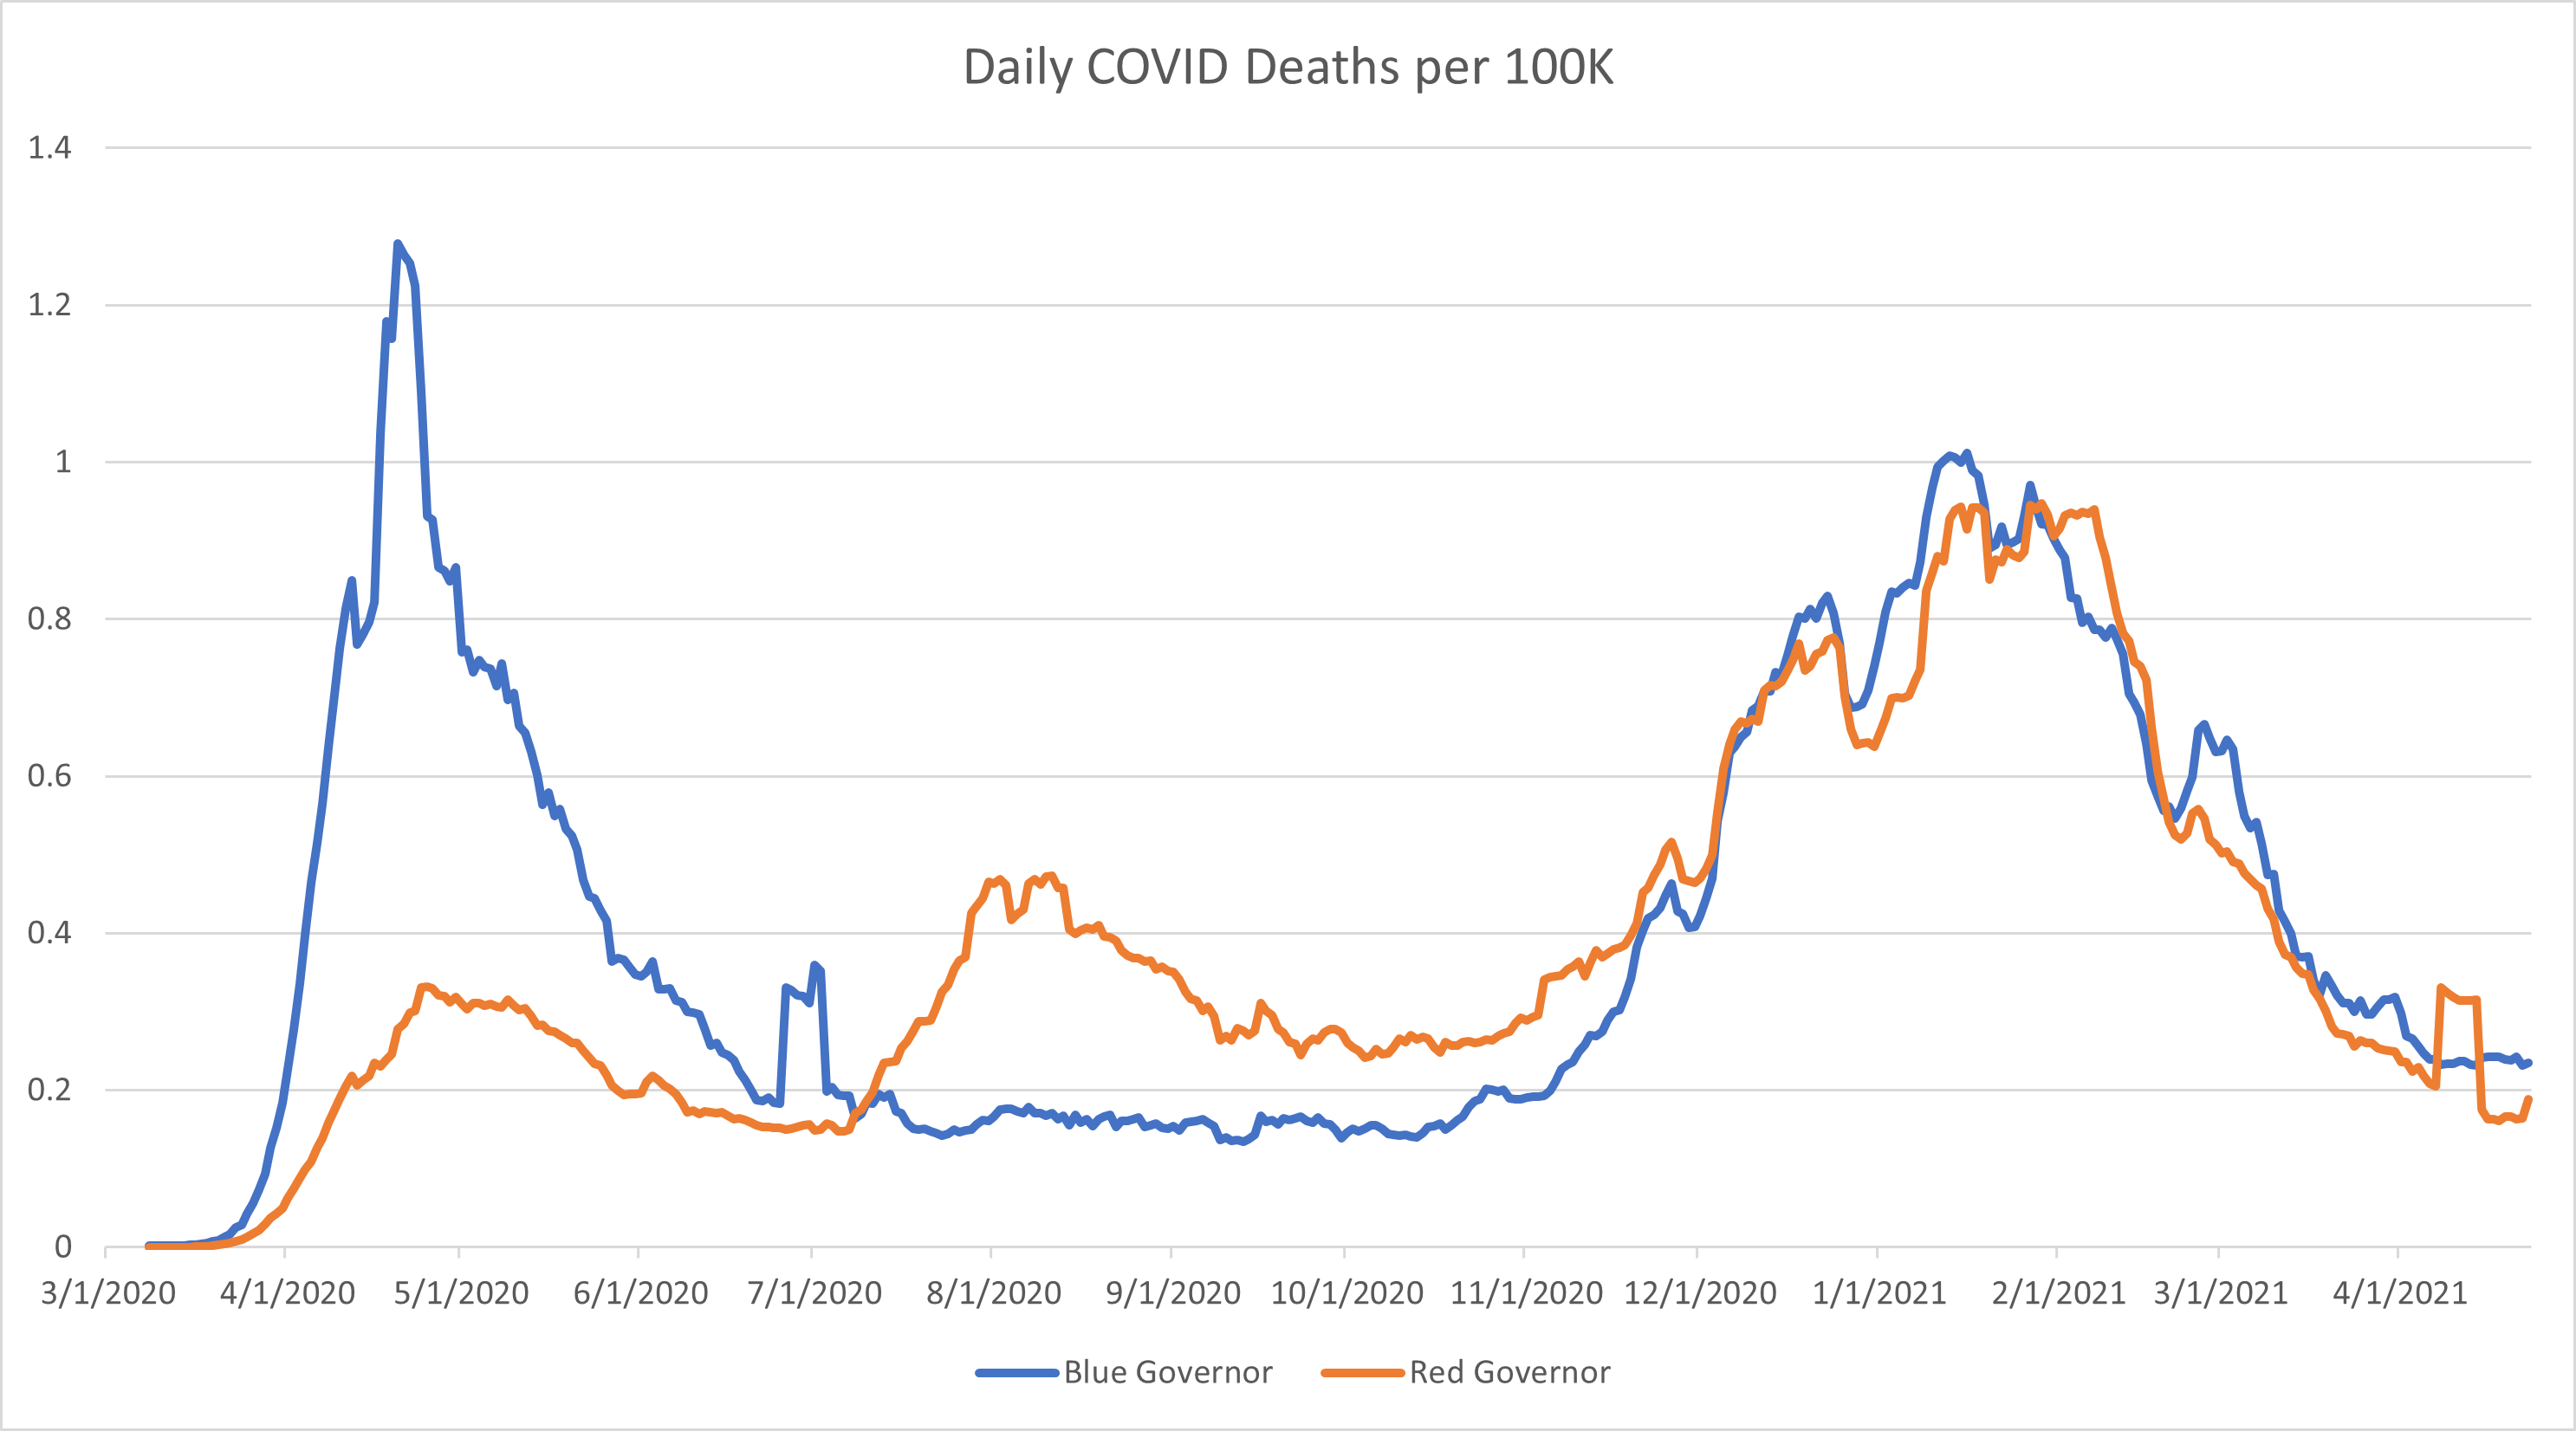
Excerpt:
The biggest problem with this study is the fact that they made what is an elementary statistics error and it went all the way to publication and no one caught it.
The authors took the per capita COVID case and death numbers among the “red states” and “blue states” and ran an analysis on them. In doing this, they gave North Dakota the same weight as Texas and Hawaii the same weight as New York despite the obvious population differences. Their chart is tiny and unreadable, so I’ve roughly duplicated their work here.
At first glance, this looks like the authors at least have their data correct. It looks like, after the initial wave, states with red governors had consistently higher patterns of cases and deaths from the summer all the way through the winter surge.
However, what we’re seeing here is due to the fact that the authors weighted the death rates for small and rural states with the same weight that they applied to high population states. This is a statistics error that is so common it has its own name: Simpson’s Paradox. It is when you take the average of the averages instead of calculating the overall average based on the properly weighted data.
Author(s): PoliMath
Publication Date: 13 May 2021
Publication Site: Marginally Compelling at substack
Link: https://polimath.substack.com/p/vaccine-efficacy-and-the-immunity
Graphic:
Excerpt:
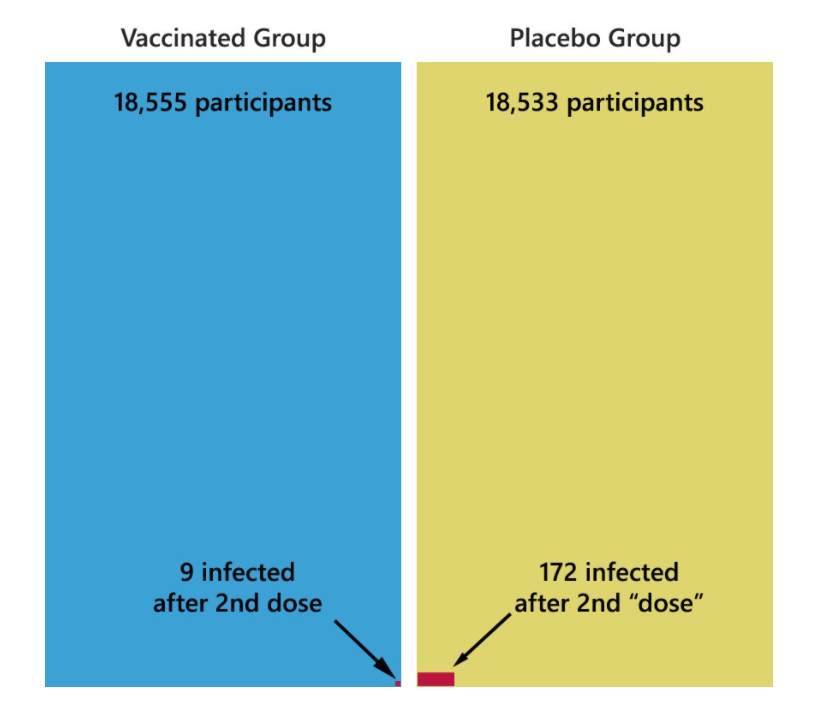
Let’s refer back to the Pfizer study submitted to the FDA. In that study, 18,555 people were vaccinated and 18,533 people received the placebo injection. In these groups, 7 days after the second dose was administered, we saw that the vaccinated group got infected at only 5% the rate that the placebo group was infected.
Furthermore, this is the number of cases we see over the course of a two month study. So those 9 people out of 18,555 were not symptomatic and infectious that whole time, but only for a few weeks.
So, to take CNN’s example and re-imagine it for the reality we have with this data.
Let’s say 1 million people are travelling. If everyone is unvaccinated (and the window of infection is roughly one week), there will be about 1,100 infected travelers.
If, however, everyone is vaccinated, there will be about 60 infected travelers and their chance of infecting you (my dear vaccinated friend) is reduced substantially.
Author(s): PoliMath
Publication Date: 13 April 2021
Publication Site: Marginally Compelling on substack
Link: https://polimath.substack.com/p/what-we-hope-is-the-final-covid-surge
Graphic:
Excerpt:
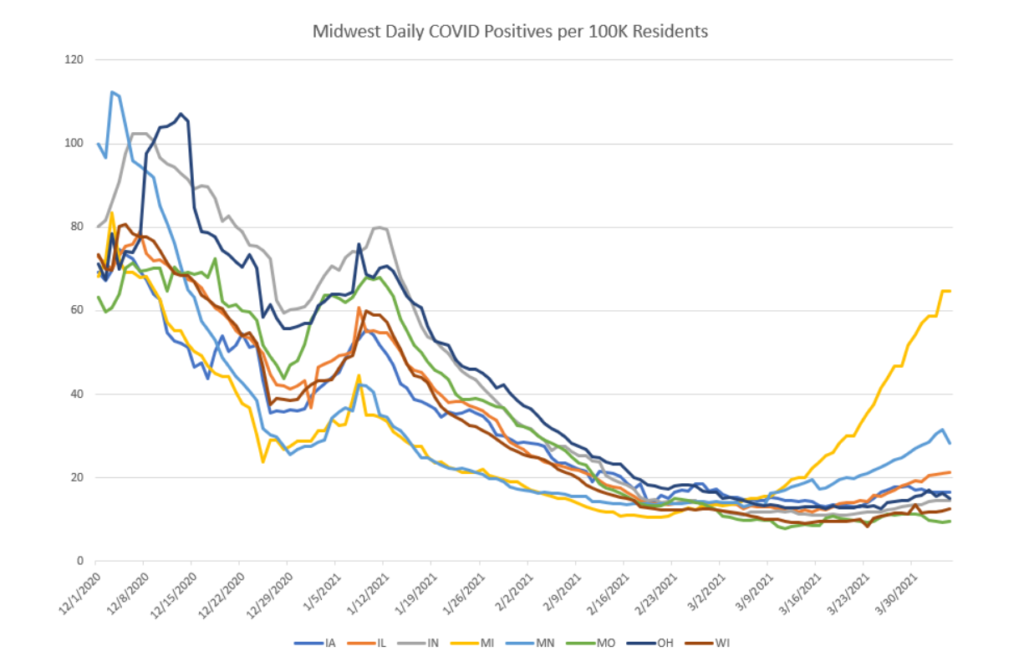
My current plan is to stop following COVID numbers after this coming May. But a lot of that plan rested on this assumption that, as we get really high up there with vaccine numbers, the COVID data would become less and less interesting as it just kind of fizzles out.
Michigan is currently putting that assumption to the test.
*takes deep breath*
The numbers out of Michigan have all the markings of a classic COVID surge. I could maybe make the case that it’s not as steep as we would have expected and maybe it will plateau in the next week or two, but I’ve been expecting that the rate of vaccinations would temper this kind of a surge.
Author(s): PoliMath
Publication Date: 6 April 2021
Publication Site: Marginally Compelling at Substack
Link: https://polimath.substack.com/p/on-covid-origins-cf5
Excerpt:
From what I know, which is (if I’m being generous) 10% of the available information:
zoonotic origin (animal to human) is not off the table. This is a plausible theory. Also, we have no hard evidence supporting it. In fact, there is a frustrating lack of evidence supporting it.
lab escape is not off the table. This is a plausible theory with precedent. We have no hard evidence supporting it. But also, the CCP has closed the door on investigating this possibility so we are unlikely to learn any new information on this absent a defection from a Chinese scientist or researcher.
lab manipulation is unlikely, though “manipulation” is a really generous term. It could mean anything from “the virus mutated in the lab to become more dangerous” to “they used some intentional genetic manipulation technology to make it more dangerous”. Again… I find this unlikely and we absolutely zero evidence that this was done.
Author(s): PoliMath
Publication Date: 9 March 2021
Publication Site: Marginally Compelling at Substack
Link: https://polimath.substack.com/p/every-states-covid-numbers-in-context-7e1
Graphic:
Excerpt:
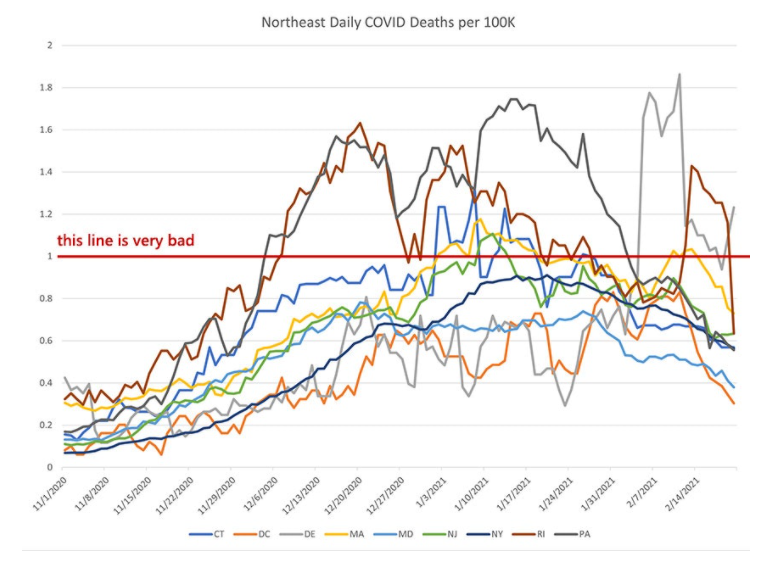
Comparing the northeast to the mountain states is a near-perfect microcosm of why I tend to think that this pandemic is largely running out on its own schedule with interventions making only a limited impact. We can see the northeast surging shortly after the mountain states and we can see that they are trailing behind on the case reductions.
Even so, we see the same pattern. Cases and deaths are past their peak and are sliding downward. Out hope is that cases can dip below the caution line within the next month or so (though I’m far past making any predictions on this).
Author(s): PoliMath
Publication Date: 23 February 2021
Publication Site: Marginally Compelling at Substack
Link: https://polimath.substack.com/p/in-which-i-finally-lose-my-mind
Excerpt:
Where does this idea that a vaccinated person could still be carrying COVID come from? Whenever you dig into the details of this concept, it comes from the fact that a rigorous study of asymptomatic COVID transmission among vaccinated participants was not a part of the Phase 3 study. In other words, we cannot *prove* that COVID *doesn’t* asymptomatically tag along for the ride in a vaccinated person.
When it comes to transmitting COVID to another person, a mask is only helpful for airborne transmission. That means the virus would have to be coming from your upper respiratory tract for a mask to be effective at stopping it. But if there is enough COVID virus in your upper respiratory tract for you to be transmitting it, then there is enough COVID virus for a testing swab to detect. In essence, if you had enough virus in your exhalations to infect another person, you would be testing positive for COVID… which is exactly the observed measurement that the vaccine prevents.
Author: PoliMath
Publication Date: 22 January 2021
Publication Site: Marginally Compelling