Income tax withholding payments stumble again

Link: https://angrybearblog.com/2023/04/income-tax-withholding-payments-stumble-again

Graphic:

Excerpt:

The important data this week will include new home sales tomorrow, Q1 GDP and initial jobless claims on Thursday, and most importantly of all (imo) real personal income and spending, along with real manufacturing and trade sales on Friday.

In the meantime, today let me take another look at a significant coincident indicator, income tax withholding payments, because the situation has changed in the past week.

….

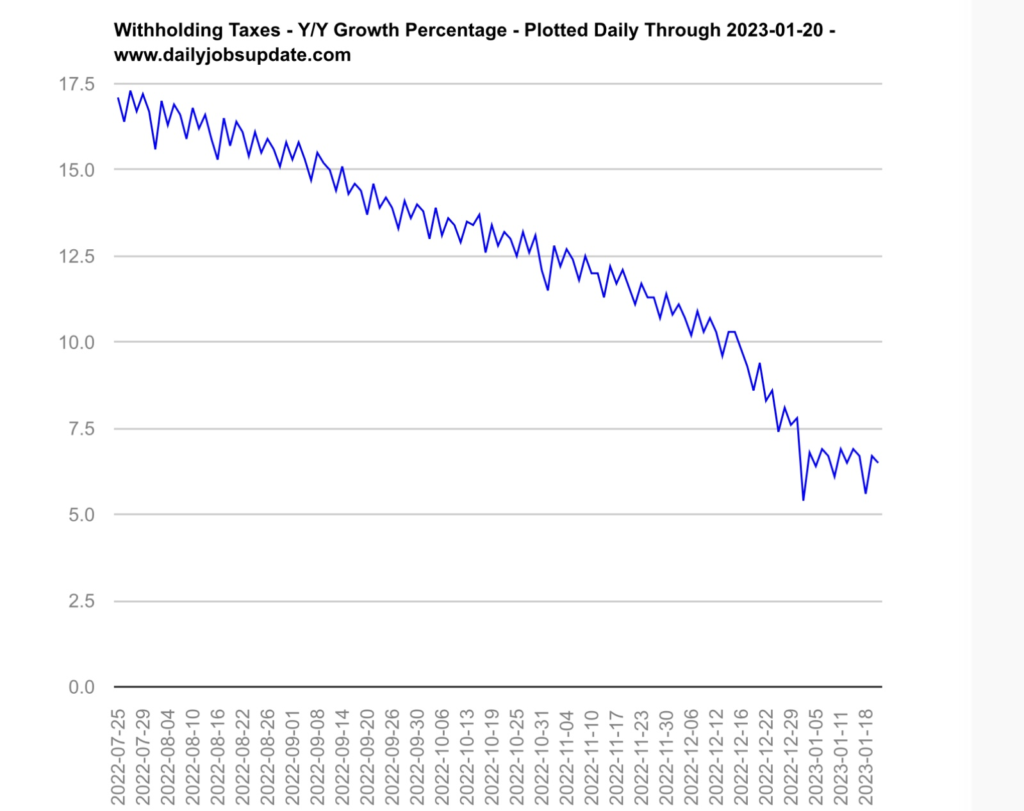
For the nation as a whole Matt Trivisonno has the YoY data, measuring the entire 365 day total of tax withholding vs. the entire previous 365 days, and has a public graph with a 3 month delay. Here’s his latest:

Like the California graph, it shows a steep deceleration during 2022, which had been as high as +21% YoY in March, down to only about +6% by the end of December. Thereafter through January, the YoY data stabilizes.

Indeed, by my own calculations, for the first three months of fiscal 2023 ending December 31, withholding tax payments were only up +1.2% YoY. But for Q2 they rebounded sharply, up +5.4% YoY. 

But in the last 10 days they have stumbled. For the first 14 withholding days in April, payments are down -3.4%, $189.7 Billion vs. $196.3 Billion one year ago. For the last 4 weeks as a whole, withholding payments are down -5.0%, $270.2 Billion vs. $284.5 Billion.

Author(s): New Deal democrat

Publication Date: 25 April 2023

Publication Site: Angry Bear

Wall Street Boosts States’ Credit Scores as Recession Worries Cloud Outlook

Link: https://www.bloomberg.com/news/articles/2023-04-19/wall-street-boosts-states-credit-scores-as-recession-woes-cloud-outlook

Graphic:

Excerpt:

Illinois, Massachusetts and New Jersey this year have garnered higher credit scores from rating companies, including brighter outlooks for the states as well. The upgrades also helped shrink bond yield spreads in the primary and secondary municipal markets, signaling investor perception of state debt is improving.

The better state ratings are due in part to the positive effect of federal pandemic aid, which some states used for one-time expenses while others set cash aside for the future. State treasuries also saw an influx of tax revenue from residents — bolstered by US stimulus money sent to individuals — who spent on services at home at the height of the pandemic, and on travel after Covid lockdowns were eased. 

Still, a slowdown in the US economy this year is causing concern that states can no longer expect a cash haul. The likelihood that the economy in the next 12 months will slide into a recession is greater now than a month earlier, according to a March 20-27 Bloomberg survey of 48 economists.

The poll, conducted after several bank closures roiled financial markets, put the odds of a contraction at 65%, up from 60% in February, amid interest-rate hikes by the Federal Reserve and growing risks of tighter credit conditions. 

Author(s): Skylar Woodhouse

Publication Date: 19 Apr 2023

Publication Site: Bloomberg

U.S. Asset Managers Fear Federal Reserve Rate Hikes Will Cause Recession

Link: https://www.ai-cio.com/news/u-s-asset-managers-fear-federal-reserve-rate-hikes-will-cause-recession/?oly_enc_id=2359H8978023B3G

Excerpt:

A significant portion of U.S.-based asset managers think further Federal Reserve rate hikes would lead to a recession or some disruption in global financial markets, according to research last month by London-based CoreData Research.

The greatest anticipated risk of continued Federal Reserve rate hikes is a possible recession. Overall, 59% of survey respondents took a neutral look at a recession scenario, that there would be “a moderate recession in 2023, followed by a gradual recovery as central bank policies bring down inflation over time,” while 14% opted for a bull case, defined as “a mild recession in the first half of 2023, followed by a strong recovery, falling inflation and rising equity markets [in the second half of 2023],” and 27% said they agree with a bear case, defined as a scenario in which “stagflation and a deep recession [occur] in 2023, accompanied by a 10-20% fall in the equity markets, as central banks struggle to defeat inflation which remains high.”

….

Within fixed income, 36% of respondents said they are increasing allocations to investment-grade corporate bonds, the most of any fixed-income subtype, and 33% are set to increase allocations to government bonds. A further 23% of respondents said they plan to cut their exposures to emerging-market debt as a consequence of higher yields domestically.

Author(s): Dusty Hagedorn

Publication Date: 24 Feb 2023

Publication Site: ai-CIO

Unemployment Rate Hits New Low of 3.4 Percent as Jobs and Employment Jump But…

Link: https://mishtalk.com/economics/unemployment-rate-hits-new-low-of-3-4-percent-as-jobs-and-employment-jump-but

Graphic:

Excerpt:

If you work one hour, you are employed. If you don’t have a job and fail to look for one, you are not considered unemployed, rather, you drop out of the labor force.

Looking for job openings on Jooble or Monster or in the want ads does not count as “looking for a job”. You need an actual interview or send out a resume.

These distortions artificially lower the unemployment rate, artificially boost full-time employment, and artificially increase the payroll jobs report every month.

Q&A What’s Going On?

Q: Hey Mish, What’s Going On?
A: People are taking on second part time jobs to make ends meet. But full time employment is stagnant no matter how one slices and dices the revisions. 

Author(s): Mike Shedlock

Publication Date: 3 Feb 2023

Publication Site: Mish Talk

The 2-10 Yield Curve Inversion Recession Signal is the Strongest in Over 40 Years

Link: https://mishtalk.com/economics/the-2-10-yield-curve-inversion-recession-signal-is-the-strongest-in-over-40-years

Graphic:

Excerpt:

The 10-year to 2-year inversion is 71 basis points, the steepest since October 1981 (see chart)

Never before have we seen such strong inversions except right before or in recessions.

It will not be different this time. A recession is on the way, assuming it’s not already started.

Author(s): Mike Shedlock

Publication Date: 22 Nov 2022

Publication Site: Mish Talk

What Dates Are Used for the U.S. Recession Bars?

Link: https://fredhelp.stlouisfed.org/fred/data/understanding-the-data/recession-bars/

Excerpt:

The monthly business cycle turning point dates on FRED graphs are as follows:

Peak, Trough
1857-06-01, 1858-12-01
1860-10-01, 1861-06-01
1865-04-01, 1867-12-01
1869-06-01, 1870-12-01
1873-10-01, 1879-03-01
1882-03-01, 1885-05-01
1887-03-01, 1888-04-01
1890-07-01, 1891-05-01
1893-01-01, 1894-06-01
1895-12-01, 1897-06-01
1899-06-01, 1900-12-01
1902-09-01, 1904-08-01
1907-05-01, 1908-06-01
1910-01-01, 1912-01-01
1913-01-01, 1914-12-01
1918-08-01, 1919-03-01
1920-01-01, 1921-07-01
1923-05-01, 1924-07-01
1926-10-01, 1927-11-01
1929-08-01, 1933-03-01
1937-05-01, 1938-06-01
1945-02-01, 1945-10-01
1948-11-01, 1949-10-01
1953-07-01, 1954-05-01
1957-08-01, 1958-04-01
1960-04-01, 1961-02-01
1969-12-01, 1970-11-01
1973-11-01, 1975-03-01
1980-01-01, 1980-07-01
1981-07-01, 1982-11-01
1990-07-01, 1991-03-01
2001-03-01, 2001-11-01
2007-12-01, 2009-06-01
2020-02-01, 2020-04-01

Publication Date: accessed 1 Nov 2022

Publication Site: FRED

The ‘Experts’ Were Never Going To Fix Inflation

Link: https://reason.com/2022/10/27/the-experts-were-never-going-to-fix-inflation/

Excerpt:

Debate now rages about whether the Federal Reserve should continue to raise interest rates to tame inflation or slow down these hikes and see what happens. This is not the first debate we’ve had recently about inflation and Fed actions. The lesson we should learn, and I fear we won’t, is that government officials and those advising them from inside or outside the government don’t know as much as they claim to about the interventions they design to control the economy.

As a reminder, in 2021, the dominant voices including Fed Chairman Jerome Powell asserted that the emerging inflation would be “transitory” and disappear when pandemic-induced supply constraints dissolve. That was wrong. When this fact became obvious, the messaging shifted: Fed officials could and would fight inflation in a timely manner by raising rates to the exact level needed to avoid recession and higher unemployment. Never mind that the whole point of raising interest rates is precisely to soak money out of the economy by slowing demand, which often causes unemployment to rise.

…..

Over at Discourse magazine, my colleague Thomas Hoenig—a former president of the Fed’s Kansas City branch—explains how Fed officials faced similar pressures during the late 1960s and 1970s. Unfortunately, he writes, “Bowing to congressional and White House pressure, [Fed officials] held interest rates at an artificially low level….What followed was a persistent period of steadily higher inflation, from 4.5% in 1971 to 14% by 1980. Only then did the [Federal Reserve Open Market Committee], under the leadership of Paul Volcker, fully address inflation.”

Often overlooked is Volcker’s accomplishment: the willingness to stay the course despite a painful recession. Indeed, it took about three years from when he pushed interest rates up to about 20 percent in 1979 for the rate of inflation to fall to a manageable level. As such, Hoenig urges the Fed to stay strong today. He writes, “Interest rates must rise; the economy must slow, and unemployment must increase to regain control of inflation and return it to the Fed’s 2% target.” There is a cost in doing this; a soft landing was never in the cards.

Author(s): VERONIQUE DE RUGY

Publication Date: 27 Oct 2022

Publication Site: Reason

Two-Year Treasury Yield Highest Since 2007, Everything Inverted Over 1 Year

Link: https://mishtalk.com/economics/two-year-treasury-yield-highest-since-2007-everything-inverted-over-1-year

Graphic:

Excerpt:

The curve has been inverted in places for over a year. This is a recession signal and I believe the economy went into recession in May. 

The Fed is merrily hiking away and is likely to keep doing so until it breaks something big time. The Fed will hike 75 basis points tomorrow and the market thinks another 75 basis points is coming in November. 

If so, it is doubtful the markets will like it much. 

Author(s): Mike Shedlock

Publication Date: 20 Sept 2022

Publication Site: Mish Talk

Sources of Fluctuations in Short-Term Yields and Recession Probabilities

Link: https://www.chicagofed.org/publications/chicago-fed-letter/2022/469

Graphic:

Excerpt:

We simulate future realizations of the policy gap and the slope of inflation forecasts from the 2022:Q2 initial conditions through 2023:Q4 using the ABC model. We then evaluate the recession probability predicted by our preferred probit model for each of these simulated paths. Through this analysis, we show that future inflation outcomes and the odds of a recession depend critically on both the pace of removal of monetary policy accommodation and on how restrictive the monetary policy stance will become over the medium term. In particular, we highlight two scenarios: The first one, which we refer to as the “baseline case,” reflects the ABC model forecasts or, equivalently, the average of all simulated paths. The second one, which we label the “tighter-policy scenario,” is characterized by a faster removal of monetary policy accommodation; it is identified by the average of the simulated paths in which policy becomes restrictive by the end of 2022.11

1. Baseline case: As of early June 2022, the ABC model predicts that nominal and real yields will rise over the next six quarters, the current policy gap will narrow and become mildly restrictive in mid-2023, while core inflation will fall and remain around one percentage point above its model-implied longer-run expectations through 2023 (figure 2, blue lines in panels A and B). The expected tightening of the policy gap and a downward-sloping expected inflation path combine to increase the one-year-ahead recession probability to about 35% by 2023 (figure 2, blue line panel C). Such a level is comparable to the one estimated ahead of the 1994 monetary policy tightening cycle that was followed by a soft-landing scenario.

2. Tighter-policy scenario: In this alternative scenario, monetary policy becomes more restrictive than in the baseline case, in that the policy gap is markedly restrictive over 2023. In this case we find that core inflation declines more rapidly than under the baseline, closing the gap with its model-implied longer-run expectations almost completely by the end of 2023. By that date, in this scenario the likelihood of a recession approaches 60%, a level that, based on our historical estimates, is generally followed by a recession in our sample (figure 2, red lines).

Author(s): Andrea Ajello , Luca Benzoni , Makena Schwinn , Yannick Timmer , Francisco Vazquez-Grande

Publication Date: August 2022

Publication Site: Federal Reserve Bank of Chicago

Business Cycle Dating Procedure: Frequently Asked Questions

Link: https://www.nber.org/business-cycle-dating-procedure-frequently-asked-questions

Excerpt:

Q: The financial press often states the definition of a recession as two consecutive quarters of decline in real GDP. How does that relate to the NBER’s recession dates?

A: Most of the recessions identified by our procedures do consist of two or more consecutive quarters of declining real GDP, but not all of them. In 2001, for example, the recession did not include two consecutive quarters of decline in real GDP. In the recession from the peak in December 2007 to the trough in June 2009, real GDP declined in the first, third, and fourth quarters of 2008 and in the first and second quarters of 2009. Real GDI declined for the final three quarters of 2001 and for five of the six quarters in the 2007–2009 recession.

Q: Why doesn’t the committee accept the two-quarter definition?

A: There are several reasons. First, we do not identify economic activity solely with real GDP, but consider a range of indicators. Second, we consider the depth of the decline in economic activity. The NBER definition includes the phrase, “a significant decline in economic activity.” Thus real GDP could decline by relatively small amounts in two consecutive quarters without warranting the determination that a peak had occurred. Third, our main focus is on the monthly chronology, which requires consideration of monthly indicators. Fourth, in examining the behavior of production on a quarterly basis, where real GDP data are available, we give equal weight to real GDI. The difference between GDP and GDI—called the “statistical discrepancy”—was particularly important in the recessions of 2001 and 2007–2009.

Author(s):

Publication Date: 19 July 2021 last updated, accessed 3 August 2022

Publication Site: NBER

Pension Plunge Puts Eric Adams in Future Financial Squeeze

Link: https://www.thecity.nyc/2022/8/1/23287828/pension-plunge-eric-adams

Excerpt:

New York City’s pension funds lost 8.65% of their value for the fiscal year that ended June 30, according to a release Friday from city Comptroller Brad Lander. 

While more detailed information won’t be released until September, the losses reduced the pension funds to about $240 billion.

While the S&P 500 stock index fell 14% in the first six months of 2022, Lander said that all is well with the pension funds “Despite market declines on a scale that hasn’t been seen in decades, the New York City retirement system outperformed our benchmarks and are well positioned to weather market volatility in the long run,” he said in a statement.

But the city budget — currently $101 billion — will still take a hit.

Author(s): Greg David

Publication Date: 1 Aug 2022

Publication Site: The City