Tracking the Population Crisis

Link:https://www.nextbigfuture.com/2023/07/tracking-the-population-crisis.html

Graphic:

Excerpt:

South Korea only had 18,988 births in May, 2023 which is the lowest births since the agency started compiling the data in 1981. This was a drop of over 5% from May 2022. The number of deaths in the country moved up 0.2 percent over the period to 28,958, resulting in a natural decrease in population by 9,970. South Korea is losing about 120,000 people per year and the total birth is about 230,000 per year which is down from 705,000 from 1990 to 1994 and 669,000 from 1995 to 1999. However, after the 1997-98 Asian Economic Crisis, the number plummeted to an average of 500,000 in the early 2000s.

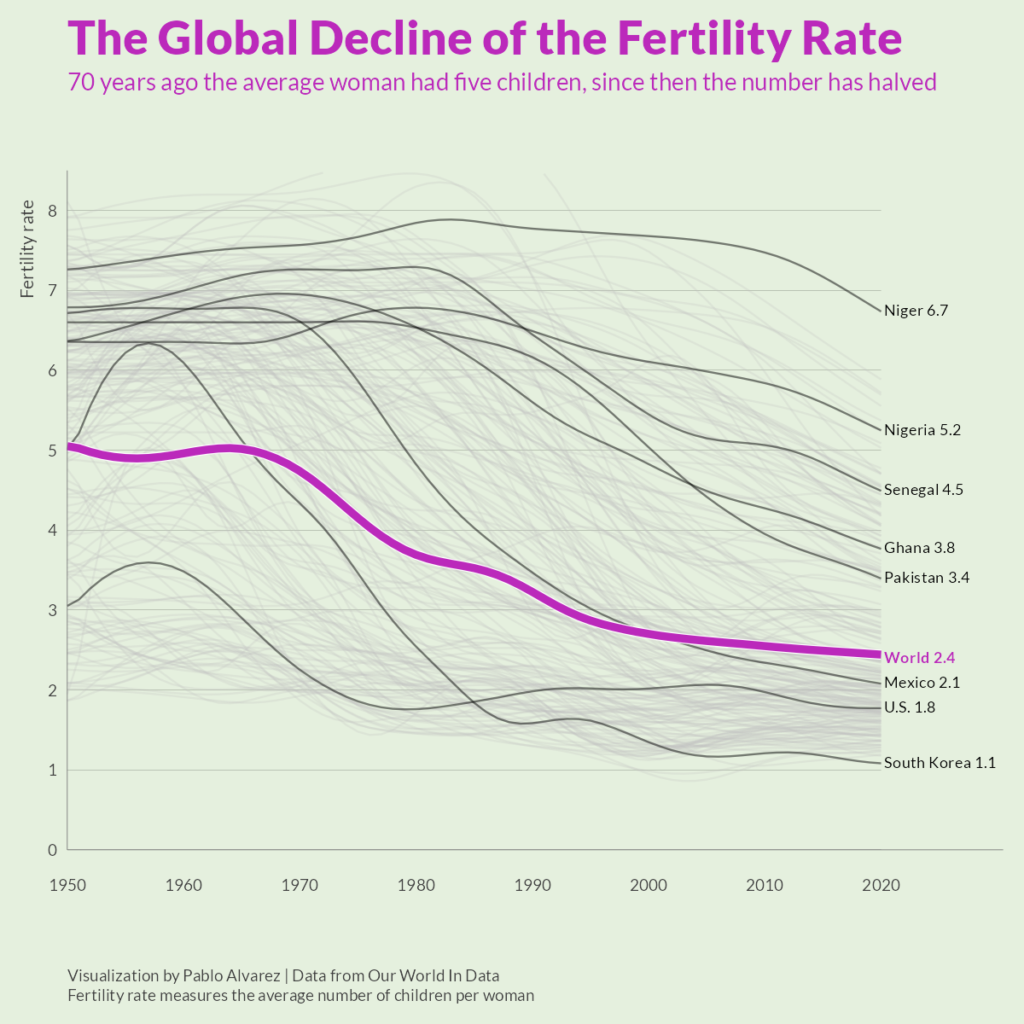
Korea’s fertility rate dropped to a new low of 0.78, the lowest among countries in the Organization for Economic Cooperation and Development, and possibly the world.

Korea would need to triple its annual births to 700,000 per year to maintain and stabilize its population.

Statistics Korea expected people aged 65 and above will take up 20 percent of the population in 2025, marking a sharp rise from 18.4 percent estimated for this year.

The Korean government sees the next five years as critical to increasing fertility and salvaging the country.

Korea’s government is considering easing the burden of gift taxes exclusively for newlywed couples, by raising the minimum amount of cash they can receive from parents without being taxed to either 100 million won ($76,000) or 150 million won.

Several municipalities have also introduced similar programs. Seongnam, Gyeonggi Province, held two couple matchmaking events in July for unmarried men and women who either live or work in the region. As a result, 39 couples found a match.

….

Japan is the world’s first “hyper-aged” country, where at least 21 percent of the population is older than 65, with projections predicting 40 percent of the population will be over retirement age by 2050.

Author(s): Brian Wang

Publication Date: 26 July 2023

Publication Site: Next Big Future

Charted: The Global Decline of Fertility Rates

Link: https://www.visualcapitalist.com/cp/charted-the-global-decline-of-fertility-rates/

Graphic:

Excerpt:

Over the last 50 years, fertility rates have dropped drastically around the world. In 1952, the average global family had five children—now, they have less than three.

This graphic by Pablo Alvarez uses tracked fertility rates from Our World in Data to show how rates have evolved (and largely fallen) over the past decades.

What’s The Difference Between Fertility Rates and Birth Rates?

Though both measures relate to population growth, a country’s birth rate and fertility rate are noticeably different:

  • Birth Rate: The total number of births in a year per 1,000 individuals.
  • Fertility Rate: The total number of births in a year per 1,000 women of reproductive age in a population.

Author(s): Pablo Alvarez

Publication Date: 10 Jun 2022

Publication Site: Visual Capitalist

Baby bust: economic stimulus helps births rebound from coronavirus pandemic

Link: https://www.ft.com/content/32436917-00b8-447d-8d6c-41f4be72b03f?accessToken=zwAAAYA7wc2Wkc8yQ2kXALhEfdONbEH0vnKwPw.MEYCIQCFBH5WrakQgRbrgONBrhQRQnrxaYYTg1X8IXTM2IkKsgIhAP6ebnRh2QH5MftGwbJQho_8W3OrJhT_fi3J_mwJO02F&sharetype=gift?token=1738330e-13c3-4b99-8852-a179ac664411

Graphic:

Excerpt:

The number of births in advanced economies has largely rebounded to levels before the coronavirus pandemic, a Financial Times analysis shows, a recovery that experts say was partly because of stimulus policies deployed to mitigate the economic impact of the crisis.

Births began to fall sharply in late 2020 after Covid-19 took hold and people were confined to their homes in lockdown, worsening an already perilous demographic trend of population decline in wealthy nations.

The trend mirrored drops during the 1918 flu pandemic, the Great Depression and the global financial crisis in 2008. But an analysis of national data shows a rapid rebound in most developed countries.

…..

The global fertility rate peaked at five in 1960 and has since been in freefall. As a result, demographers believe that, after centuries of booming population growth, the world is on the brink of a natural population decline.

According to a Lancet paper published in 2020, the world’s population will peak at 9.7bn in about 2064, dropping to 8.7bn around the end of the century. About 23 nations can expect their populations to halve by 2100: Japan’s population will fall from a peak of 128mn in 2017 to less than 53mn; Italy’s from 61mn to 28mn.

Low fertility rates set off a chain of economic events. Fewer young people leads to a smaller workforce, hitting tax receipts, pensions and healthcare contributions.

Author(s): Federica Cocco, Lyman Stone

Publication Date: 18 Apr 2022

Publication Site: Financial Times

More Than An Insolvency Date: What Else To Know About The Social Security And Medicare Trustees’ Reports

Link: https://www.forbes.com/sites/ebauer/2021/09/01/more-than-an-insolvency-date-what-else-to-know-about-the-social-security-and-medicare-trustees-reports/

Excerpt:

This year, Social Security’s deficit is unusually high due to lower revenues and higher benefits: 1.75%. In 2040, the deficit climbs to 3.70% rather than 3.54%. In 2080, the deficit stands at 4.87% rather than 4.59%.

Put another way, if there were no Trust Fund accounting mechanism now, the OASI program would have been able to pay 93% of benefits. This would drop to 76% in 2035 – 2040 – 2045, then drop further to being able to pay 70% of benefits.

What’s more, this year, the actuaries changed several assumptions. They assume that by the year 2036, fertility rates will increase to 2.00 children per woman, an increase from the 2020 report’s assumption of 1.95. They also assume a long-term unemployment rate of 4.5% rather than 5%. At the same time, they calculate alternate projections with more pessimistic assumptions, including a continuingly low fertility rate (1.69), a higher rate of mortality improvement (that is, longer-lived recipients), a higher rate of unemployment (5.5%), and others. In these alternate calculations, the 2040 deficit becomes 6.47% rather than 3.7% (benefits 64% payable), and the 2080 deficit becomes 12.39% rather than 4.87% (benefits 50% payable).

Also consider that, at the moment, there are 2.7 workers for each Social Security recipient (2.8 in 2020). This is forecast to drop to 2.2 in 2040 and ultimately down to 2.1. But if the population trends are those of the pessimistic scenario, then that 2.1 would drop to 1.5 by the year 2080.

Author(s): Elizabeth Bauer

Publication Date: 1 September 2021

Publication Site: Forbes

The Decline in U.S. Fertility

Graphic:

Excerpt:

In the United States and other developed countries, fertility tends to drop during periods of economic decline. U.S. fertility rates fell to low levels during the Great Depression (1930s), around the time of the 1970s “oil shock,” and since the onset of the recent recession in 2007 (see Figure 1). The U.S. total fertility rate (TFR) stood at 2.0 births per woman in 2009, but preliminary data from the National Center for Health Statistics show that the TFR dropped to 1.9 in 2010—well below the replacement level of 2.1.1 A similar decline—or leveling off—of fertility rates has been reported in Ireland, Italy, Spain, Sweden, and several other European countries.

Author(s): Mark Mather

Publication Date: 18 July 2012

Publication Site: PRB

Baby boom to baby bust (CSM 1985)

Link: https://www.csmonitor.com/1985/1127/z1love3.html

Excerpt:

In the ’70s, these overpopulation alarms had widespread impact. A 1970 survey found that 69 percent of married women in America agreed that US overpopulation was a “serious problem” — and that many of them were lowering the number of children they intended to have.

Now, however, the birthrate in the industrial world is below the “replacement rate” of 2.1 children per woman. That rate is set at the number of children needed to replace every parent, with more added to account for mortality.

In 1855, white American women averaged 5.31 births — well above the then-current replacement rate of 3.32 (higher then because of higher infant mortality). By 1980, the figure had dropped to 1.75 children each — well below the 2.1 replacement rate. Even the high birthrate of US Hispanics — 56 percent more than non-Hispanics in 1982 — doesn’t raise the total US rate above replacement levels.

Author(s): Rushworth M. Kidder

Publication Date: 27 November 1985

Publication Site: Christian Science Monitor