Link: https://doodles.mountainmath.ca/blog/2021/01/30/on-covid-trend-lines/
Graph:
Excerpt:
WHY TREND LINES
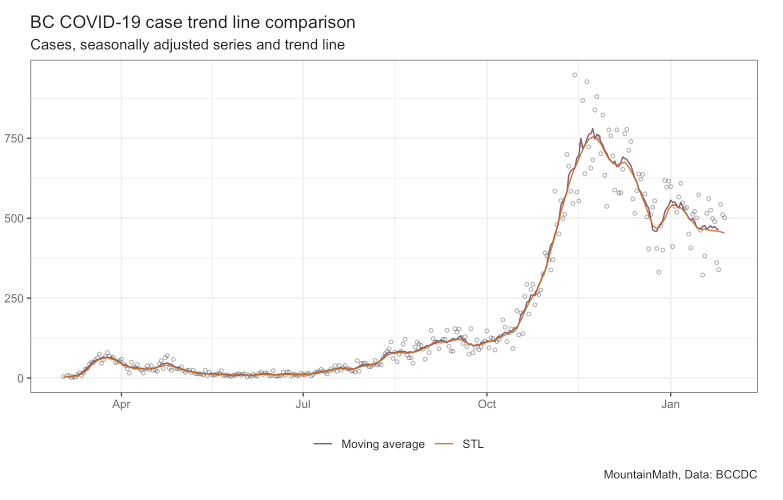
Data is inherently noisy, trend lines are a way to filter out noise and focus on the main movements of a time series. “Are we trending up or down?” is a simple yet important question, but it can be hard to answer by just looking at the raw data. In that sense a trend line is simply a way to de-noise the data.
But how do we distinguish noise from the “real” signal in the data? First we need to understand the “data generating process”. In case of COVID-19 timelines that’s viral growth, so we expect the main signal of our time series to be exponential growth with periods of constant growth rates, with noise added on top of that. (This can also be tested directly by running tests on the COVID-19 cases time series.)
Author: JENS VON BERGMANN
Publication Date: 30 January 2021
Publication Site: Mountain Doodles