When planning for retirement, it’s important to consider all the risks, and one consideration that individuals often overlook is “longevity risk.” Longevity risk refers to the chance a person could outlive their savings. Understanding longevity and reasonably estimating the probabilities of living to various advanced ages and the risk of outliving resources are important for planning a secure retirement.
As a result of healthy lifestyles, medical advancements and scientific discoveries, it has become much more common for people these days to live into their 80s and 90s — or even their 100s! In fact, Pew Research Center writes that, according to estimates by the U.S. Census Bureau, there are about 101,000 centenarians in the U.S. in 2024, and this population could quadruple to about 422,000 in 2054.
While a long life is something most people desire, it requires planning for a longer retirement than in the past. For example, if a worker retires at 67, planning for a 20-year retirement may not be enough, and if they live to be in their 90s, or even past 100, they could outlive their savings or end up with fewer assets to leave their heirs.
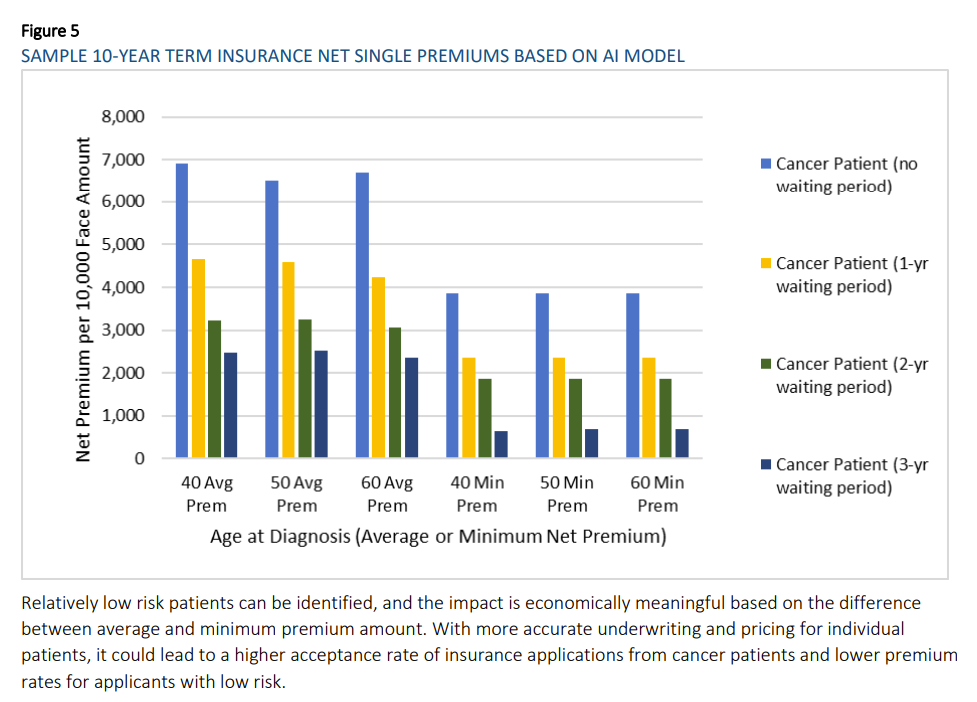
The Society of Actuaries (SOA) Research Institute’s Mortality and Longevity Strategic Research Program Steering Committee issued a call for essays to explore the application of artificial intelligence (AI) to mortality and longevity. The objective was to gather a variety of perspectives and experiences on the use of AI in mortality modeling, forecasting and prediction to promote discussion and future research around this topic.
The collection includes six essays that were accepted for publication from all submissions. Two essays were chosen for prizes based on their creativity, originality, and likelihood of further thought on the subject matter.
Author(s): multiple
Publication Date: September 2024
Publication Site: Society of Actuaries, SOA Research Institute
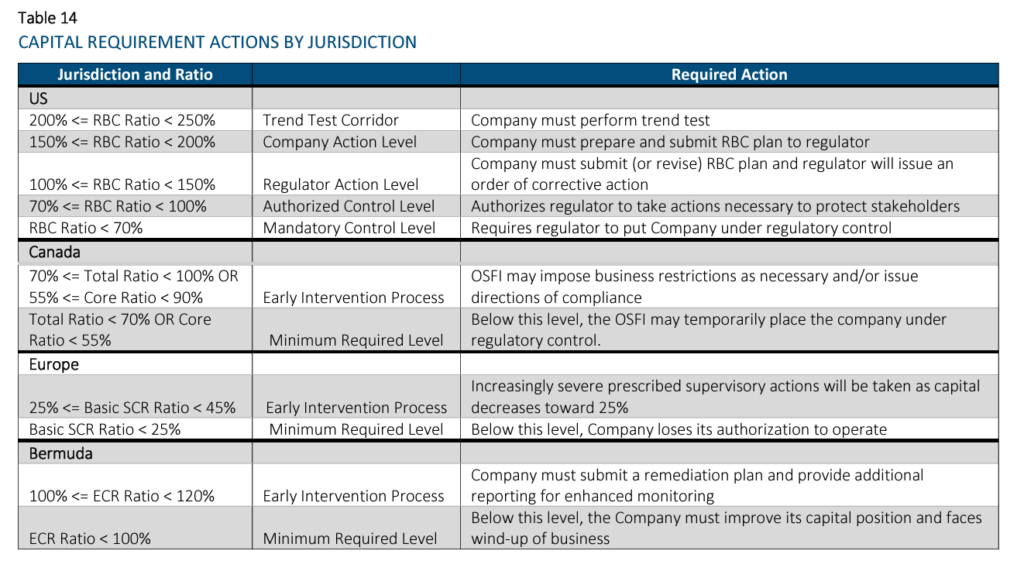
The purpose of this paper is to introduce the concept of capital and key related terms, as well as to compare and contrast four key regulatory capital regimes. Not only is each regime’s methodology explained with key terms defined and formulas provided, but illustrative applications of each approach are provided via an example with a baseline scenario. Comparison among these capital regimes is also provided using this same model with two alternative scenarios.
The four regulatory required capital approaches discussed in this paper are National Association of Insurance Commissioners’ (NAIC) Risk-Based Capital (RBC; the United States), Life Insurer Capital Adequacy Test (LICAT; Canada), Solvency II (European Union), and the Bermuda Insurance Solvency (BIS) Framework which describes the Bermuda Solvency Capital Requirement (BSCR). These terms may be used interchangeably. These standards apply to a large portion of the global life insurance market and were chosen to give the reader a better understanding of how required capital varies by jurisdiction, and the impact of the measurement method on life insurance company capital.
All of these approaches are similar in that they identify key risks for which capital should be held (e.g., asset default and market risks, insurance risks, etc.). However, they differ in significant ways too, including their defined risk taxonomy and risk diversification / aggregation methodologies, as well as required minimum capital thresholds and corresponding implications. Another key difference is that the US’s RBC methodology is largely factor-based, while the other methodologies are model-based approaches. For the model-based approaches, Solvency II and BIS allow for the use of internal models when certain conditions are satisfied. Another difference is that the RBC methodology is largely derived using book values, while the others use economic-based measurements.
As mentioned above, this paper provides a model that calculates the capital requirements for each jurisdiction. The model is used to compare regulatory solvency capital using identical portfolios for both assets and liabilities. For simplicity, we have assumed that all liabilities originated in the same jurisdiction as the calculation. As the objective of the model is to illustrate required capital calculation methodology differences, a number of modeling simplifications were employed and detailed later in the paper. The model considers two products – term insurance and payout annuities, approximately equally weighted in terms of reserves. The assets consist of two non-callable bonds of differing durations, mortgages, real estate, and equities. Two alternative scenarios have been considered, one where the company invests in riskier assets than assumed in the base case and one where the liability mix is more heavily weighted to annuities as compared to the base case.
Author(s): Ben Leiser, FSA, MAAA; Janine Bender, ASA, MAAA; Brian Kaul
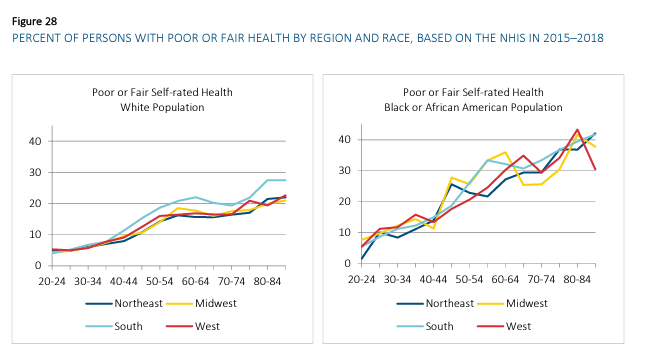
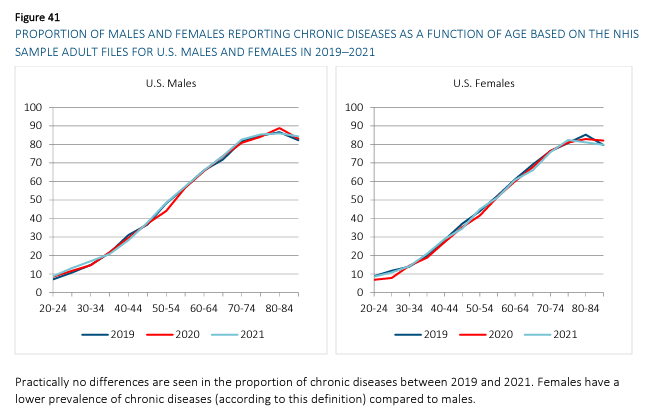
The SOA Research Institute’s Mortality and Longevity Strategic Research Program is pleased to make available a research report that quantifies differences in mortality and disease prevalence by health status. Additionally, period life tables by health status, sex, and age are available in Appendix D.
Author(s):
Natalia S. Gavrilova, Ph.D. Leonid A. Gavrilov, Ph.D.
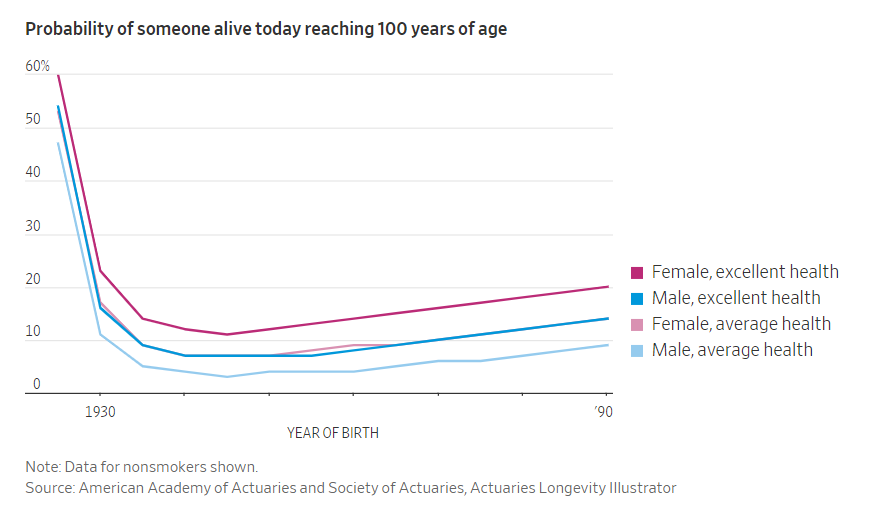
Demographers and actuaries make the following distinction between life expectancy and longevity: Life expectancy refers to the average number of years someone will live from a given age, whereas longevity refers to how long he or she might live if everything goes well, typically expressed as the probability of living beyond a certain age such as 85, 90 or even 100.
A growing body of evidence shows that many people are ignorant of their so-called longevity risk—the probability of living a very long time—and the complications that presents.
….
Drs. Hurwitz and Mitchell note that retirement calculators provide information about average life expectancy, but not longevity. They have found that about five times as many Census Bureau publications relate to life expectancy as longevity. Thus, people who have planned appropriately for their life expectancy might miss how likely they are to live longer.
….
People can look up their longevity risk with an online Longevity Illustrator maintained by the American Academy of Actuaries and Society of Actuaries, based off the latest mortality data from the Social Security Administration.
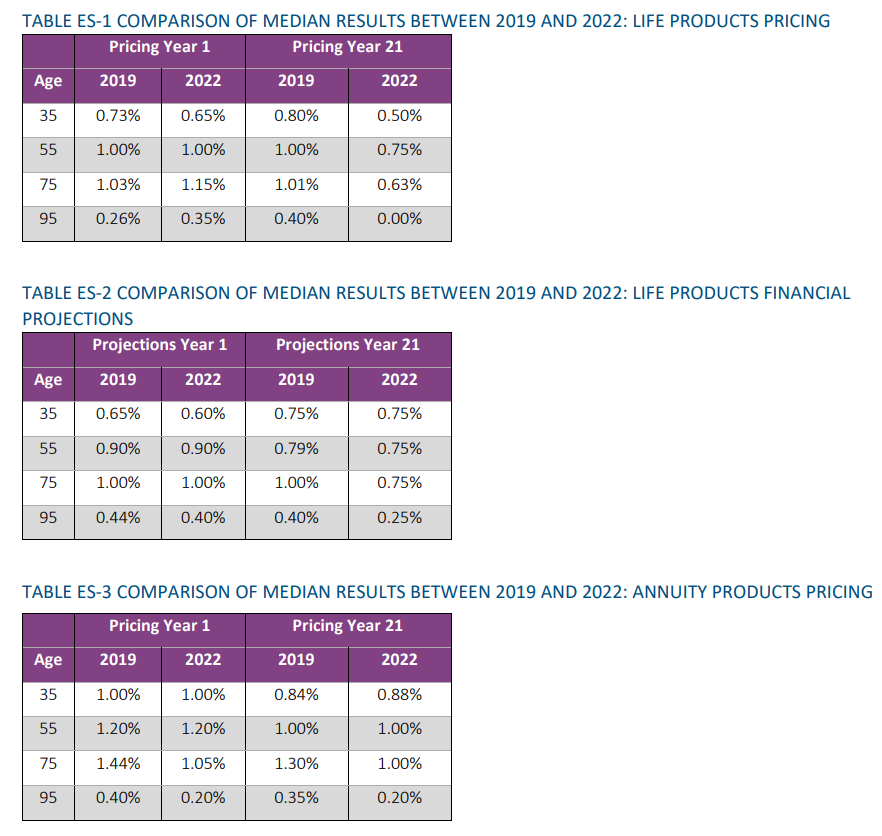
The Committee on Life Insurance Mortality and Underwriting Surveys of the Society of Actuaries sent companies a survey in May of 2019 on mortality improvement practices as of year-end 2018. The survey results were released in January 2022. The survey was completed by respondents prior to the onset of COVID-19. The present report provides an opportunity to update the results for pandemic-based changes and compare the before and after surveys. The 2022 survey was opened in March 2022 and closed by the end of April. Thirty-five respondent companies participated in this survey, with 29 from the U.S. and six from Canada. This group was further divided between direct writers (26) and reinsurers (nine). This survey focused on the use of mortality improvement and how it has changed for financial projection and pricing modeling following the initial stages of COVID-19. Details regarding assumptions and opinions on mortality improvement in general were asked of the respondents. National Association of Insurance Commissioners discussions on mortality improvement factors due to COVID-19 for reserving purposes have taken place, but this survey was conducted before any adjustments reacting to them. Seventy-four percent (26 of 35) of respondents indicated using durational mortality improvement assumptions in their life and annuity pricing and/or financial projections. Moreover, of those that used durational mortality improvement assumptions, attained age and gender were the top two characteristics in which assumptions varied. Respondents were asked to indicate the different limitations when applying durational mortality improvement assumptions. The Survey found that the most common lowest and highest attained age to which durational mortality improvement was applied were 0 and about 100, respectively. The lowest and highest durational mortality improvement rate ranged from -1.50% (deterioration) to 2.80% (improvement). The time period in which the mortality improvement rates were applied ranged from 10 to 120 years, but this varied between life (10/120) and annuities (30/120). The most common time period was 20 to 30 years for life; less consensus was seen for annuities. Analysis is provided in Appendix C for instances when highlights are shared in the body of the report.
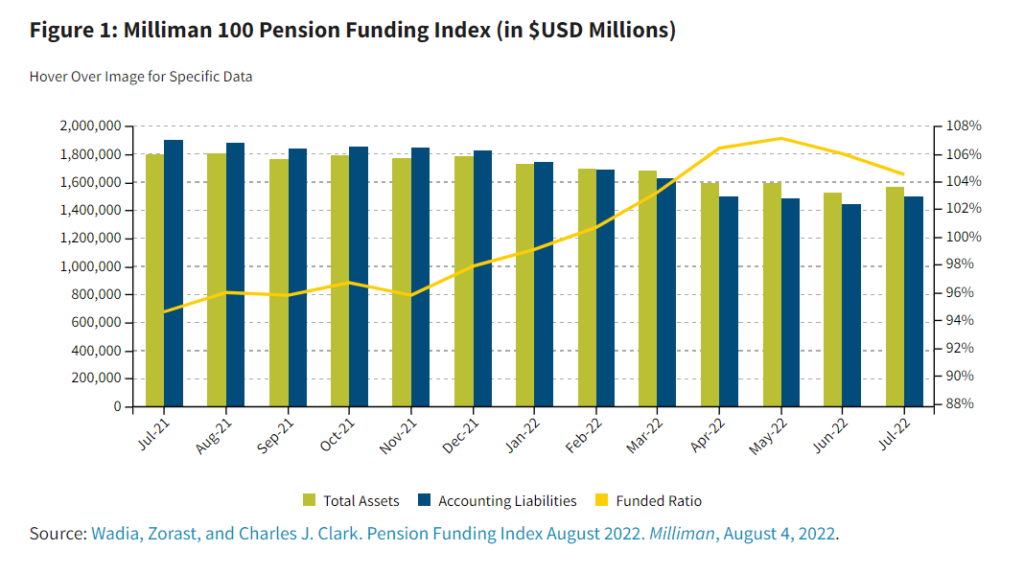
Higher interest rates already have translated into higher discount rates for solvency and accounting valuations, which means good news (lower liabilities) for DB pension plans. The sensitivity of a pension plan’s liabilities to the discount rate used to determine their value depends on the demographics of the plan members, the type of valuation and level of discount rates being used. Generally, the “duration” for most pension plan liabilities (defined here as the percentage decrease in liabilities for a 1% increase in discount rates) will range from 10 to 25.
In the United States, the average accounting funded ratio increased from 94.6% in July 2021 to 104.5% in July 2022, according to the Milliman 100 Pension Funding Index, despite significant decreases in plan assets during that time. This is because the average accounting discount rate (typically based on long-term, high-quality bond yields) increased from 2.59% to 4.25% during that same period, driving down accounting liabilities at a faster pace than asset losses. Figure 1 demonstrates this effect in more detail.
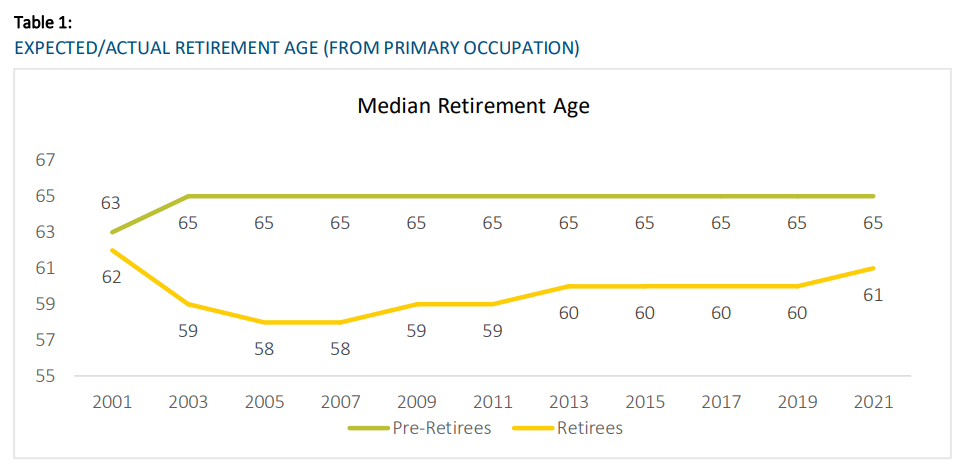
CHAPTER HIGHLIGHTS: • Despite the COVID-19 pandemic, level of concern about various risks remains historically low this year for both pre-retirees and retirees. Compared to 2019, level of concern dropped on some issues for retirees. As a result of this drop, retiree concerns are lower than those of pre-retirees by a larger gap than ever before. • The one exception to this trend was concern about fraud. In 2021, both retirees and pre-retirees were more concerned about fraud, and it is the highest concern among retirees, particularly Black/African American retirees. As in prior studies, those with lower income tend to show much higher levels of concern. • The biggest concerns for pre-retirees are their savings and investments not keeping up with inflation, not being able to afford long-term care, not being able to afford health care costs, not being able to maintain a reasonable standard of living throughout retirement, and potentially depleting all their savings. • While half of pre-retirees plan to retire gradually rather than all at once, retiree respondents indicate this seldom actually happens. Higher-income pre-retirees are more likely to plan to go straight from full time employment to retirement. • The COVID-19 pandemic has not affected plans that pre-retirees have for work, living arrangements, and lifestyle in retirement, although over a quarter report changing their lifestyle. • Despite the financial challenges that retirement poses, most do not have financial advisors, especially preretirees, lower-income respondents, and Black/African American respondents.
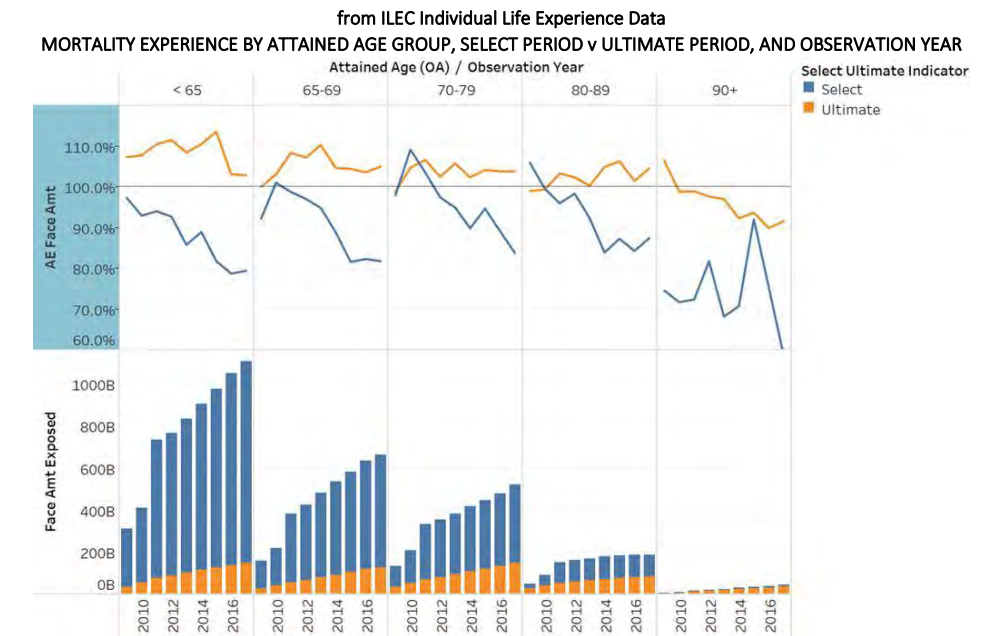
The Society of Actuaries (SOA) Research Institute released a report that examines older age mortality (OAM) with a focus on attained ages 70 and above. The report helps determine whether refinements were needed in the 2015 Valuation Basic Tables. Analysis was performed by sex, issue age and attained age, issue year cohorts, smoking risk classification, benefit band, select vs ultimate period, and interactions.
Author(s):
Old Age Mortality Subgroup of the Individual Life Experience Committee
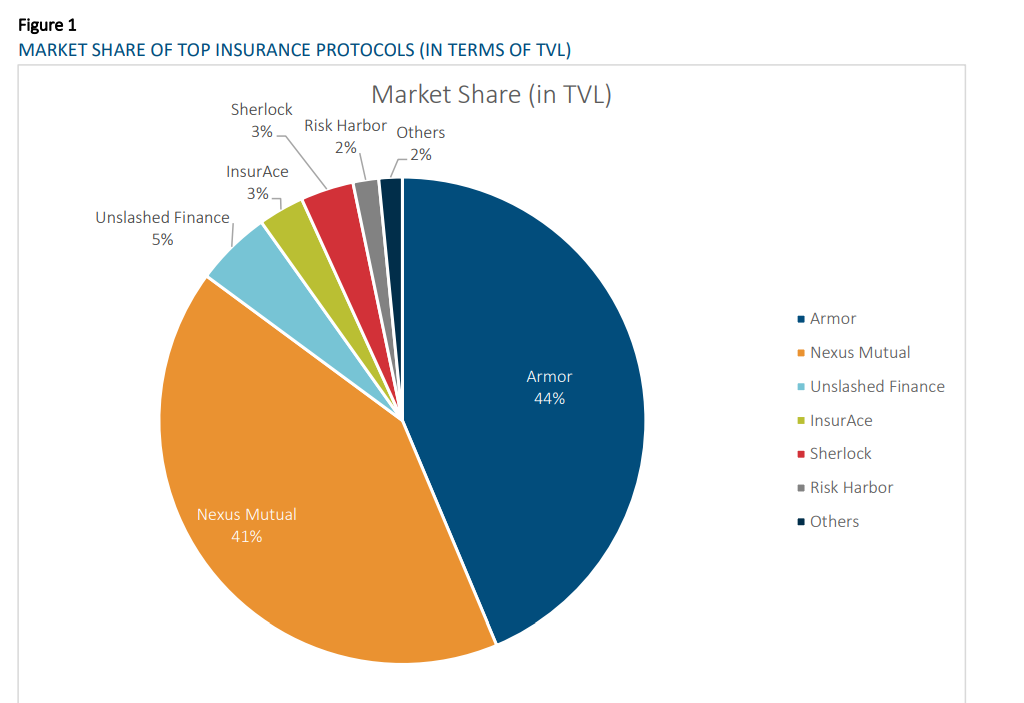
The DeFi ecosystem has been expanding rapidly in the past few years, growing from less than USD $1 billion in 2020 to USD $61.6 billion as of June 2022 as measured by Total Value Locked (TVL), the amount of crypto asset deposited in the DeFi protocols.
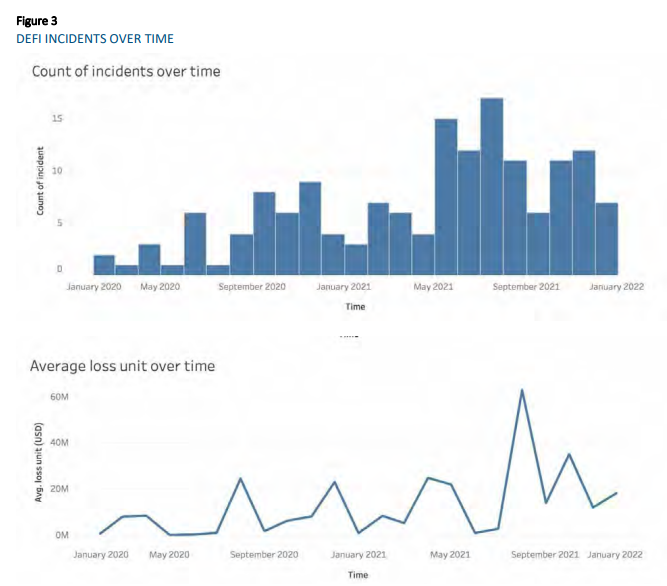
With continuous innovation in product design and delivery, the potential of DeFi adoption is massive. However, the rise of DeFi is marred by security issues. Nearly 200 blockchain hacking incidents have taken place in 2021 with approximately USD $7 billion in stolen funds (Cointelegraph, 2021). These hacking events have a wide range of causes including, but not limited to, the following:
Smart contract vulnerabilities exploited by hackers to steal funds
Manipulation of oracles to cause price feed deviation
Attack on governance where a small group of individuals took over the protocol’s governance decisionmaking mechanism
Decentralized finance (DeFi) is an emerging and rapidly growing financial ecosystem with the defining feature that it is powered by blockchain technology. The focus of this paper is on risks for DeFi protocols that could lead to economic losses that could be insurable. This framework was designed around the risks associated with the existing and emerging DeFi protocols.
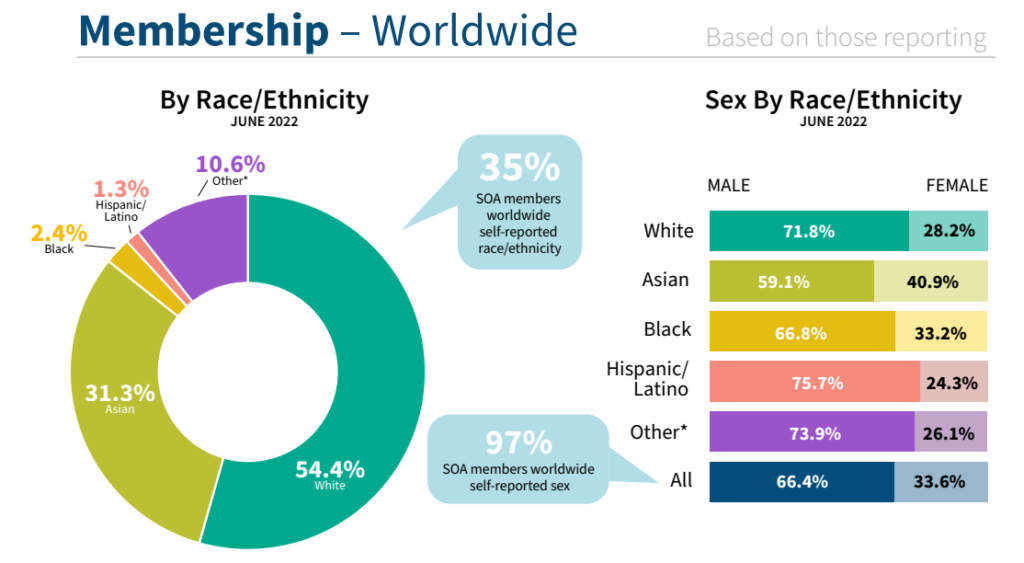
The Society of Actuaries (SOA) leadership and staff work closely with the Diversity, Equity, and Inclusion Committee (DEIC) to support the journey to increase diversity in membership and in the actuarial profession, as part of the SOA’s Long-Term Growth Strategy.
We strive for transparency and accountability in our DEI efforts and are committed to sharing our demographic data and long-term goals to support our pledge and responsibility. We have collected member voluntary demographic data since 2015. With this data, we present an infographic for the pathway from aspiring actuaries to members with ASA or FSA designations.