Why the life insurance industry did not face an “S&L-type” crisis

Link: https://econpapers.repec.org/article/fipfedhep/y_3a1993_3ai_3asep_3ap_3a12-24_3an_3av.17no.5.htm

PDF link: https://econpapers.repec.org/scripts/redir.pf?u=http%3A%2F%2Fwww.chicagofed.org%2Fdigital_assets%2Fpublications%2Feconomic_perspectives%2F1993%2Fep_sep_oct1993_part2_brewer.pdf;h=repec:fip:fedhep:y:1993:i:sep:p:12-24:n:v.17no.5

Full reference:

Elijah BrewerThomas H. Mondschean and Philip E. Strahan

Economic Perspectives, 1993, vol. 17, issue Sep, 12-24

Graphic:

Excerpt:

In most states, coverage under guaranty

funds is $300,000 in death benefits, $100,000 in

cash or withdrawal value for life insurance,

$100,000 in present value of annuity benefits,

and $100,000 in health benefits. Some states

cover all insurance policies written by an insol-

vent firm located in the state; others cover the

policies of residents only. In the case of unallo-

cated annuities such as GICs purchased by com-

panies to fund pension plans, some states cover

up to a certain amount, usually $5 million. Oth-

er states, such as California, Massachusetts, and

Missouri, do not cover GICs.

Because of variations in state guaranty

funds and in the way insolvencies are handled,

the parties bearing the costs of an insurance

failure differ across states. Surviving insurance

companies initially pay their assessments and

claim them as an expense on their federal corpo-

rate income tax return, reducing their federal

income taxes. As companies receive tax credits

in subsequent years, these credits become tax-

able income. As a result, the federal government

bears part of the cost of an insolvency since it

does not fully recover the present value of the

tax decrease granted in the assessment year. In

states with premium tax offsets, however, the

majority of the cost is paid by state taxpayers.

A study of 1990 life/health guaranty fund assess-

ments found that 73.6 percent was paid by state

taxpayers, 8.9 percent by federal taxpayers, and

17.5 percent by the equity holders of the surviv-

ing firms.

Author(s): Elijah BrewerThomas H. Mondschean and Philip E. Strahan

Publication Date: September 1993

Publication Site: Economic Perspectives, Chicago Fed
S&P Global’s Proposed Capital Model Changes and its Implication to U.S. Life Insurance Companies

Link: https://www.soa.org/sections/financial-reporting/financial-reporting-newsletter/2022/september/fr-2022-09-sun/

Graphic:

Excerpt:

Life technical risks measure the possible losses from deviations from the best estimate assumptions relating to life expectancy, policyholder behavior, and expenses. The life technical risks are captured through mortality, longevity, morbidity, and other risks. The methodology for calculating the capital adequacy for these four risk categories remains unchanged under the proposed method, apart from the recalibration of capital charges or the consolidation of defining categories within each risk. Comparing to the current GAAP based model, charges have materially increased across all categories partly due to higher confidence intervals, with notable exceptions of longevity risk, with reduced charges across all stress levels (changes applicable to U.S. life insurers are illustrated in Tables A2 to A5 in the Appendix linked at the end of this article). Please note that S&P’s current capital model under U.S. statutory basis does not have an explicit longevity risk charge. However, this article focuses on comparison to current GAAP capital model[1] that is closer to the new capital methodology framework.

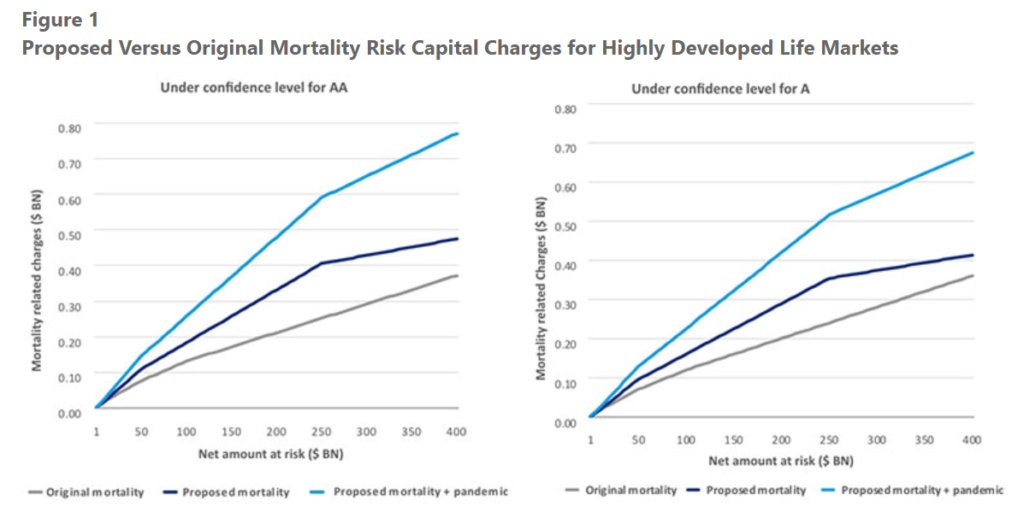
For mortality risk, lower rates are charged for smaller exposures (net amount at risk (NAR) $5 billion or less) with the consolidation of size categories, but higher rates are charged for NAR between $5 billion and $250 billion, with an average increase of 49 percent for businesses under $400 billion NAR. A new pandemic risk charge (Table A3 in the Appendix linked at the end of this article) will further increase mortality related risk charges to be 109 percent higher than original mortality charges under confidence level for company rating of AA, and 93 percent higher for confidence level for company rating of A, respectively, on average (Figure 1). The disability risk charge rates increased moderately for most products, across all eight product types such that the increase of disability premium risk charges is 6 percent under confidence level for AA, and 2 percent for A, respectively. In addition, the proposed model introduced a new charge on disability claims reserve, ranging from 13.7 percent of total disability claims reserves for AAA, to 9.6 percent for BBB. However, the proposed model provides lower capital charge rates in longevity risk and lapse risk.

Author(s): Yiru (Eve) Sun, John Choi, and Seong-Weon Park

Publication Date: September 2022

Publication Site: Financial Reporting newsletter of the SOA

New Report Measures Public Pension Health

Link: https://www.ai-cio.com/news/new-report-measures-public-pension-health/

Excerpt:

The National Conference on Public Employee Retirement Systems recently released a report entitled “Measuring Public Pension Health: New Metrics, New Approaches” that introduces new mechanisms to account and judge the sustainability of pension plans.

To create these, the report’s author, Tom Sgouros, fellow and co-chair at The Policy Lab at Brown University, formed and hosted the Pension Accounting Working Group, a group made up of actuaries and public pension experts. The group assembled to measure the health of plans, and create new metrics to generate greater insights into a pension’s sustainability, so that trustees and policymakers could make better and more informed decisions.

The working group came up with three new metrics. The first is “scaled liability,” a measurement of pension liabilities against the size of the underlying supporting economy. The second is “unfunded actuarial liability (UAL) stabilization payment,” an objectively defined cash-flow policy standard comparable to the funding ratio. And last is “risk-weighting asset values,” a method to assess the value of a plan’s assets that accounts for a plan’s capacity to endure the downside risk it has taken through the allocation of its assets.

The scaled liability measurement uses economic strength as a proxy for tax capacity. This measurement helps decisionmakers get a read on a plan’s sustainability by providing a comparison between a pension plan and the economic strength of its sponsor. The Federal Reserve includes a comparison of net pension liability with measures of GDP and state revenues in the “Enhanced Financial Accounts” component of its “Financial Accounts of the United States” report.

Author(s): Dusty Hagedorn

Publication Date: 23 Sept 2022

Publication Site: ai-CIO

Annual Report on the Insurance Industry — 2021

Link: https://home.treasury.gov/system/files/311/FIO-2021-Annual-Report-Insurance-Industry.pdf

Graphic:

Excerpt:

Figure 15 shows that the average risk-based capital ratio for the L&H sector declined slightly in

  1. Specifically, statutory capital and surplus was 4.26 times the level of minimum required
    regulatory capital on average in 2020 compared to 4.31 times the required level in 2019.

L&H sector net income of $22 billion in 2020 was less than one-half of 2019 levels, affecting the
potential for capital generation. The sector reported a nearly 10 percent increase in death and
annuity benefit expenses, which contributed to a ratio of total benefit expenses to premiums
earned of 50 percent in 2020, rising substantially from 44.4 percent in 2019. According to Fitch
Ratings, life insurer operating results in 2020 were largely impacted by higher claims paid,
primarily due to increased mortality from COVID-19.24


Certain leverage ratios indicate that L&H insurers faced balance sheet pressures in 2020. The
greater financial flexibility afforded by steady leverage ratios has enabled insurers to consistently
fulfill policyholder obligations by: (1) returning a profit by investing the premiums received
from underwriting activities; and (2) limiting the risk exposure from the policies underwritten.
Insurers also employ reinsurance in order to move some of the risks off their own balance sheets
and on to those of reinsurers. Figure 16 provides a view of the L&H sector’s general account
leverage for the last 10 years.

Author(s): Fderal Insurance Office

Publication Date: September 2021

Publication Site: U.S. Dept of the Treasury

Insuring Another Disaster

Excerpt:

Leave it to California lawmakers, however, to cast aside thousands of years of complex commercial history in a misguided attempt to fix an admittedly legitimate insurance problem. Thanks to Proposition 103, a 1988 ballot measure, California already has a distorted insurance market that gives the insurance commissioner czar-like powers to approve rate increases and impose rate decreases.

Because of that law, insurers have a tough time adjusting rates to manage their risks. It’s a long, cumbersome, and antagonistic government process to adjust rates. Their other lever for ensuring solvency is to reduce their underwriting risks by, say, not writing fire-insurance policies to homeowners who live in high fire-risk areas or car insurance policies to drivers with multiple DUIs.

….

Instead, California Assemblymember Marc Levine, D-Marin County, has introduced Assembly Bill 1522, which would prohibit insurers from canceling insurance policies solely because a home or business is located in a high-risk wildfire area. It epitomizes California’s economically illiterate edict approach.

Author(s): Steven Greenhut

Publication Date: 29 April 2021

Publication Site: The American Spectator

Solvency II Review: Call for Evidence

Link: https://www.gov.uk/government/publications/solvency-ii-review-call-for-evidence

Excerpt:

Solvency II is the regime that governs the prudential regulation of insurance firms in the UK. This call for evidence is the first stage of the review of Solvency II.

The review is underpinned by three objectives:

to spur a vibrant, innovative, and internationally competitive insurance sector

to protect policyholders and ensure the safety and soundness of firms

to support insurance firms to provide long-term capital to support growth, including investment in infrastructure, venture capital and growth equity, and other long-term productive assets, as well as investment consistent with the government’s climate change objectives.

The government seeks views on how to tailor the prudential regulatory regime to support the unique features of the insurance sector and regulatory approach in the UK.

Author(s): Her Majesty’s Treasury

Date Accessed: 24 February 2021

Publication Site: Gov.UK