How I Created a Data Visualization With Zero Coding Skills, Thanks to ChatGPT

Link: https://nightingaledvs.com/data-visualization-using-chatgpt-to-code/

Graphic:
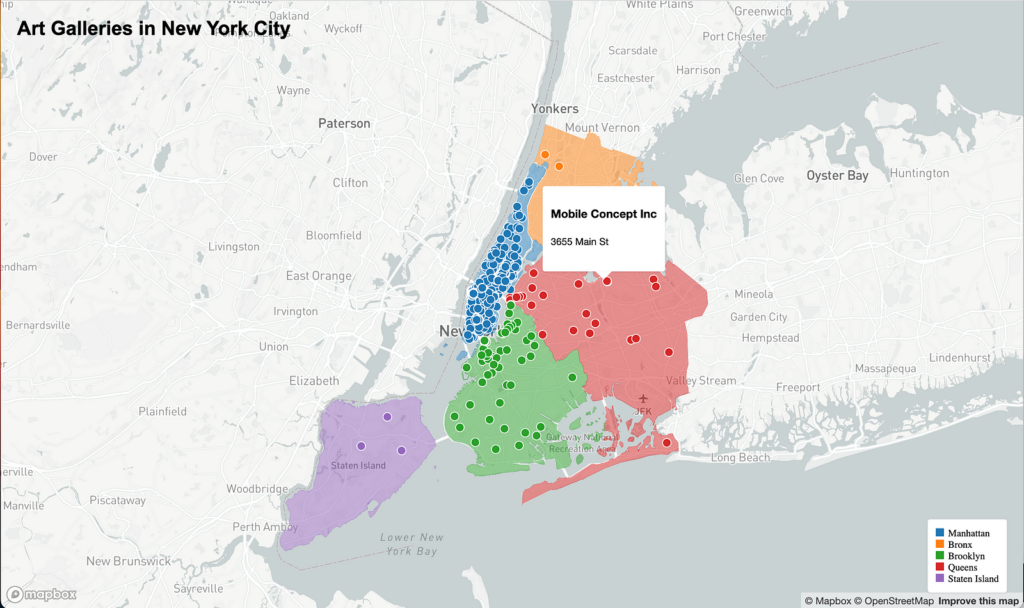
Excerpt:

Data visualization is cool but at the same time it’s bit daunting that I need to know lots of tech stacks to actually implement it.

I totally agree that even when I was studying data visualization, I spent a pretty substantial amount of time learning how to code, handle web hosting, work with Python, SQL, and more, all while absorbing knowledge on information visualization.

Thankfully, we no longer need to deep dive into technical gatekeepers in this field. This doesn’t mean that technical knowledge is not valuable, but rather that we no longer need to be intimidated by technology because AI can spoon-feed us knowledge and do the heavy lifting for us. Are you excited? Let’s get started!

I’m going to build the data visualization that one of my students posted on weekly write-up homework.

Author(s): Soonk Paik

Publication Date: 4 April 2023

Publication Site: Nightingale

THE FIRST ANNUAL CAS ACTUARIAL
TECHNOLOGY SURVEY

Link: https://www.casact.org/sites/default/files/2022-03/CAS-RP_First_Annual_CAS_Actuarial_Technology_Survey.pdf

Graphic:

Excerpt:

Excel continues to be actuaries’ most widely used software tool, with more than
94.3% of respondents reporting that they use it at least once a day.
• With that understood, most actuaries (92.3%) use more than one tool.
• Actuaries want to increase their proficiency in R (47.2%), Python (39.1%), SQL
(30.8%), and Excel (26.0%).
• No tool had more than 50% of respondents indicating that they wanted to increase
their proficiency.
• Time is the greatest barrier to learning new technology. (80.5% of respondents felt
so.)
• Newer analysis methods such as tree-based algorithms and artificial intelligence (AI)
are not widely used (16.5% and 7.0%, respectively).

Author(s): Casualty Actuarial Society

Publication Date: March 2022

Publication Site: CAS Research Paper